Feature tour
A walk through Logbook in the order you'd use it: something happens, you log it, you deal with it, you look back on it. Screenshots follow your theme (try the toggle in the header) and use made-up demo data.
Quick log
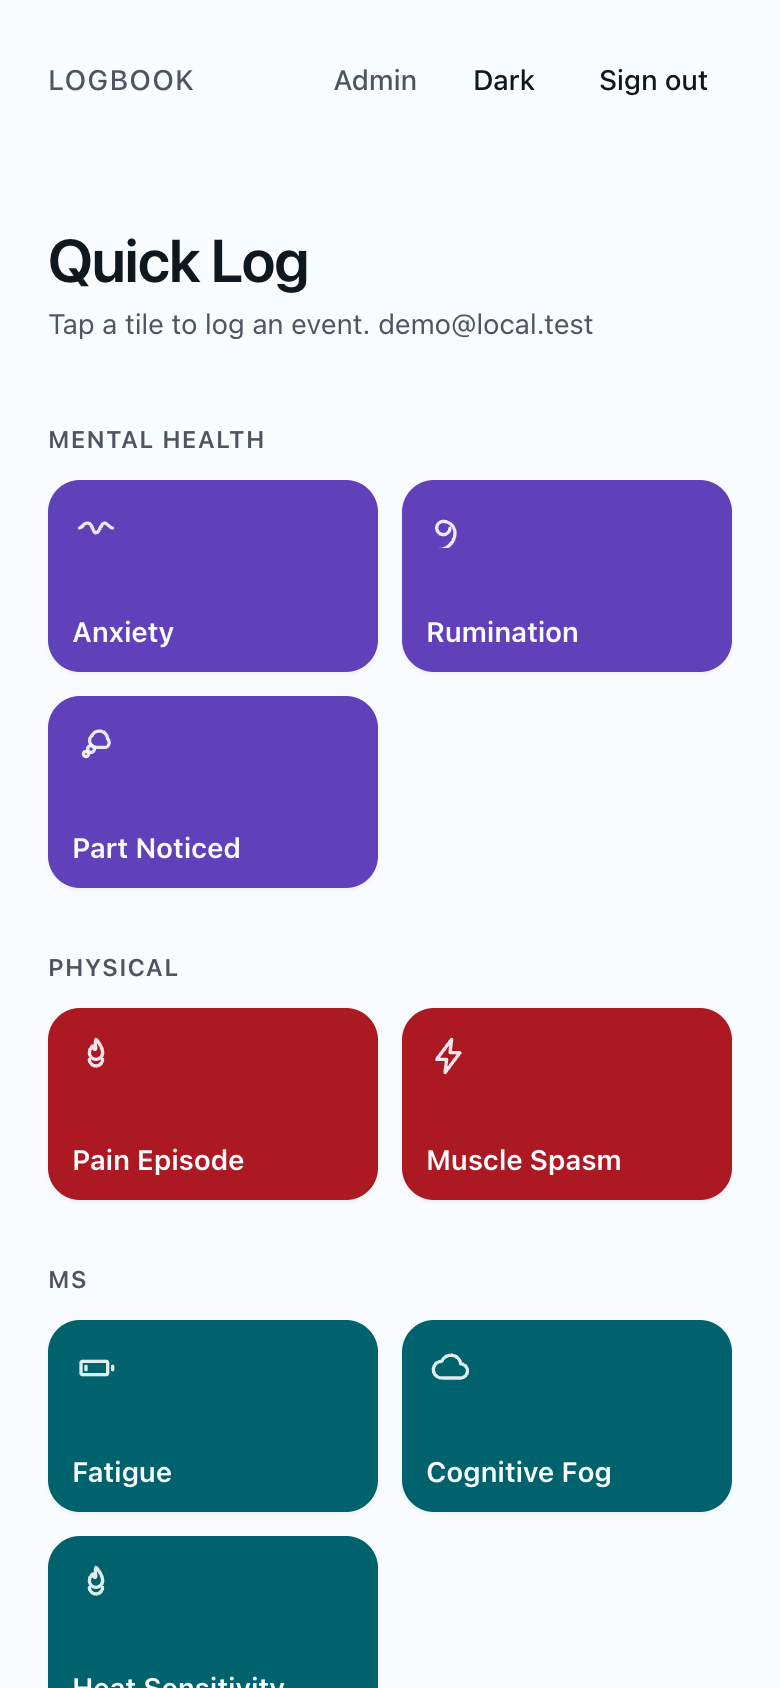
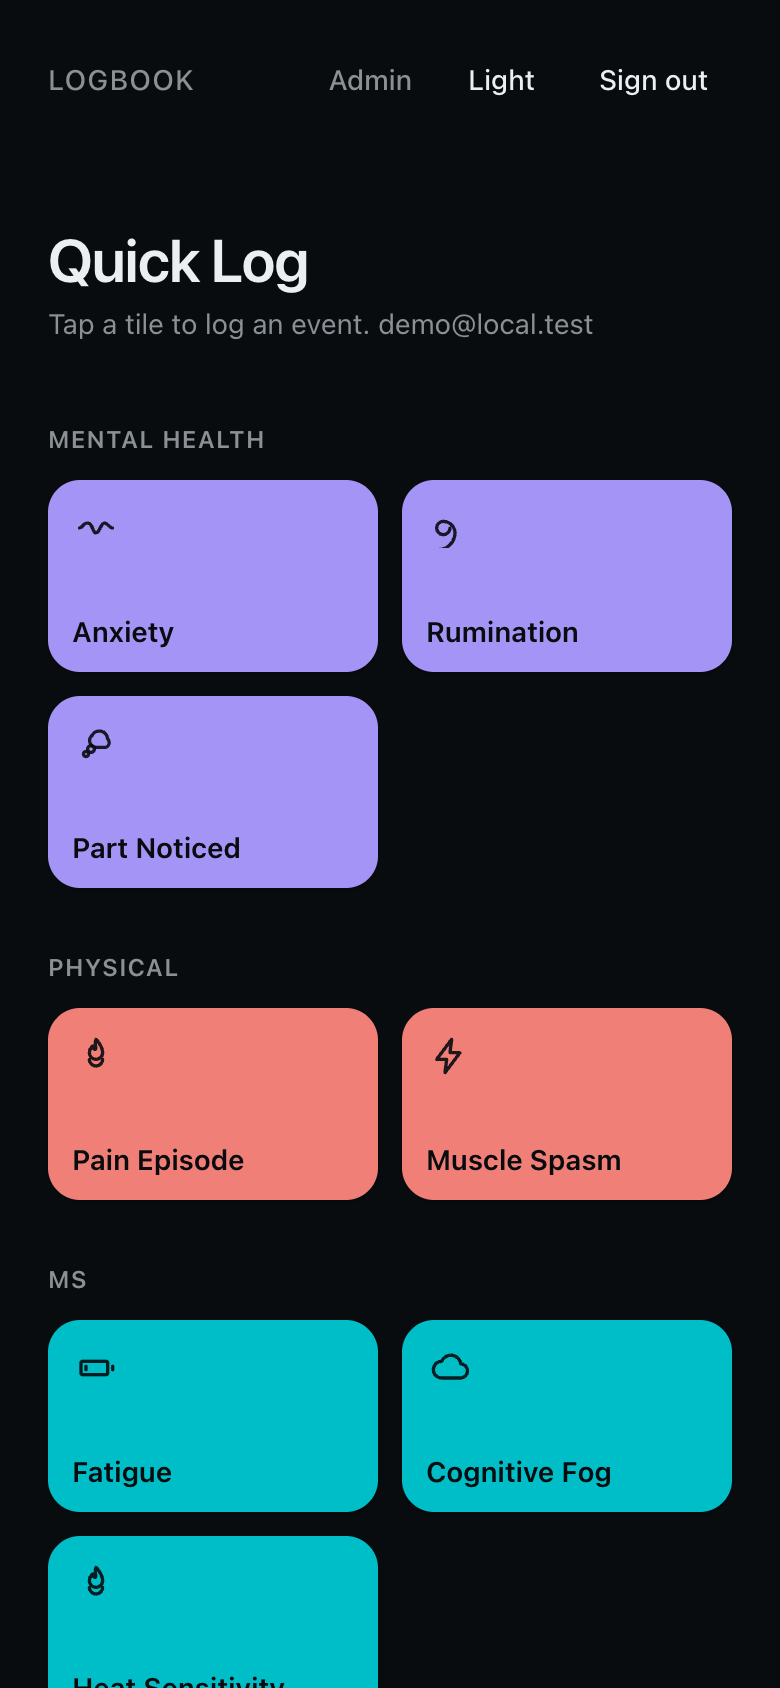
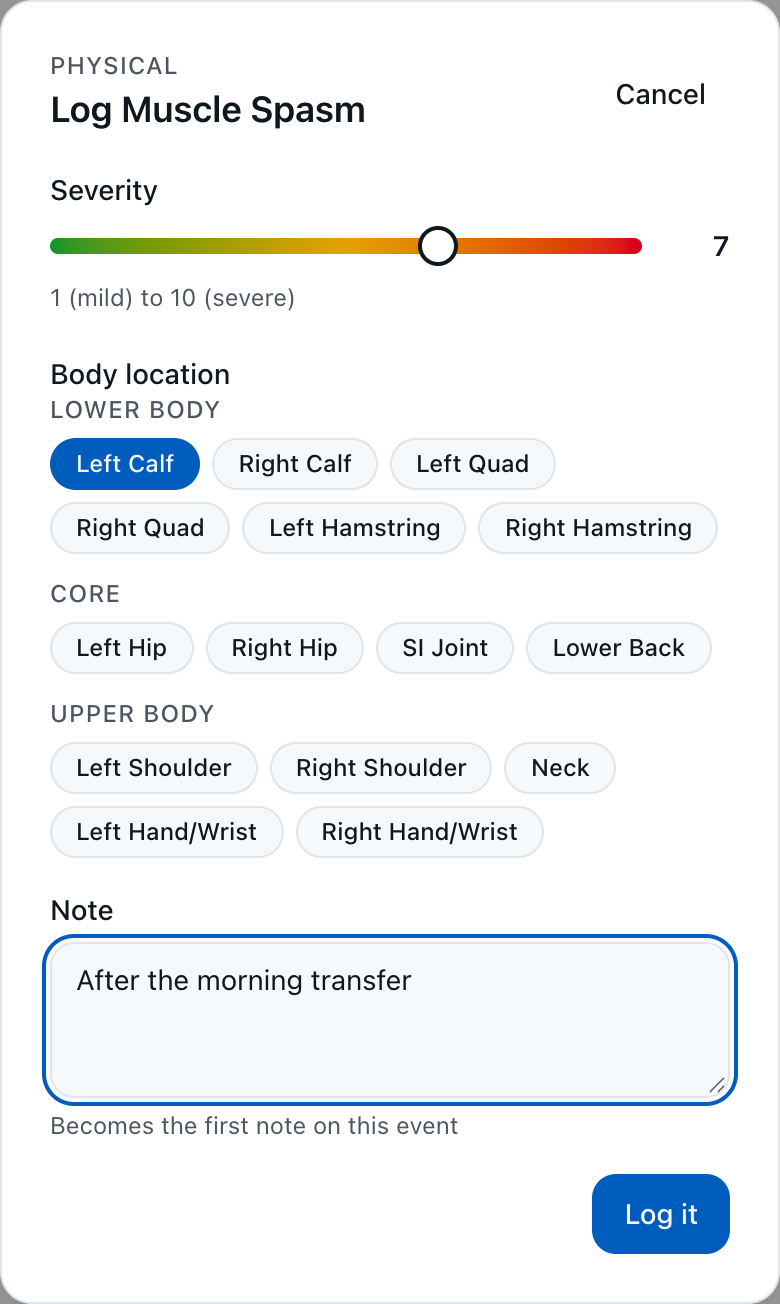
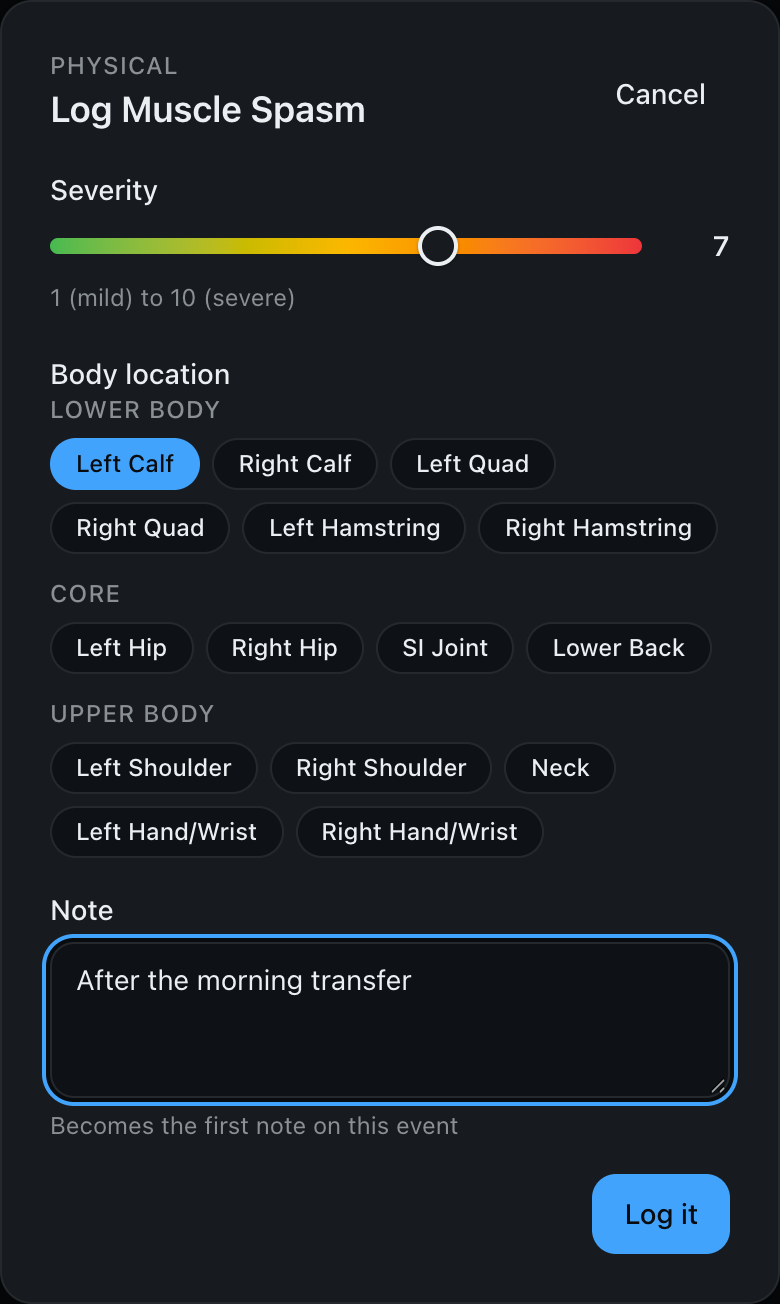
The home screen is the logging screen. Event types are big tiles, color-coded and grouped by category. Tap one and a short dialog opens:
- Severity: a 1 to 10 slider that shifts from green to red. The number is always shown, so color is never the only signal.
- Body location: tap every place that's affected, grouped by region. Only shown for types that track location.
- Extra fields for types that need them, such as consistency and amount for a bowel movement.
- Note: optional. It becomes the first entry on the event's timeline.
Log it saves, and the event appears under Recent Events.
Some types are moments rather than episodes. Bowel movements and "noticed" observations resolve themselves as soon as they're logged.
No signal? Log it anyway
If you're offline when you log, the event is queued on your device and sent as soon as the connection is back. A badge in the header shows how many are waiting.
Add what helped, then resolve
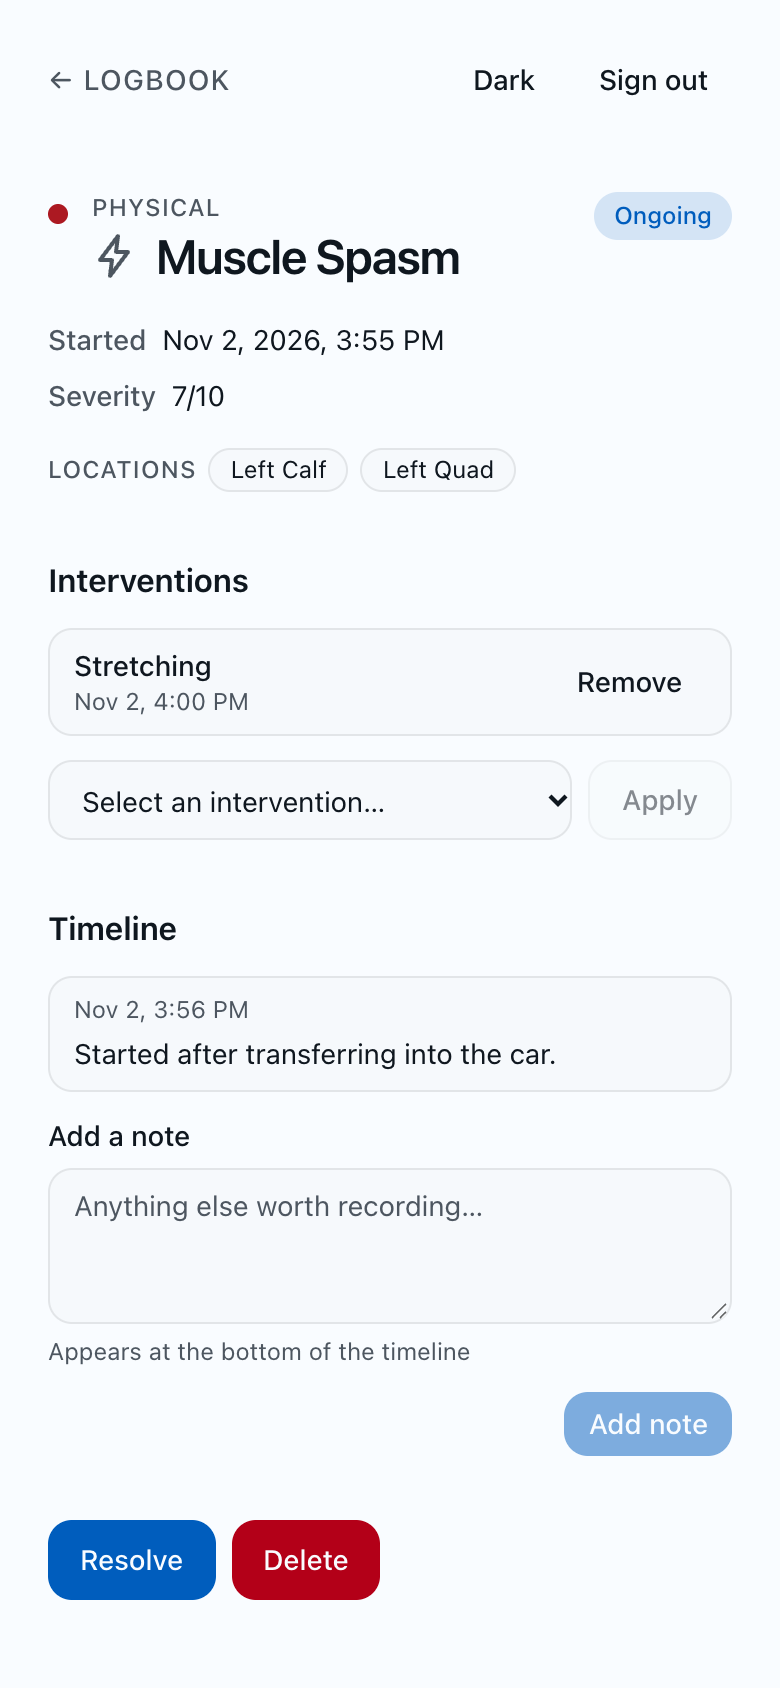
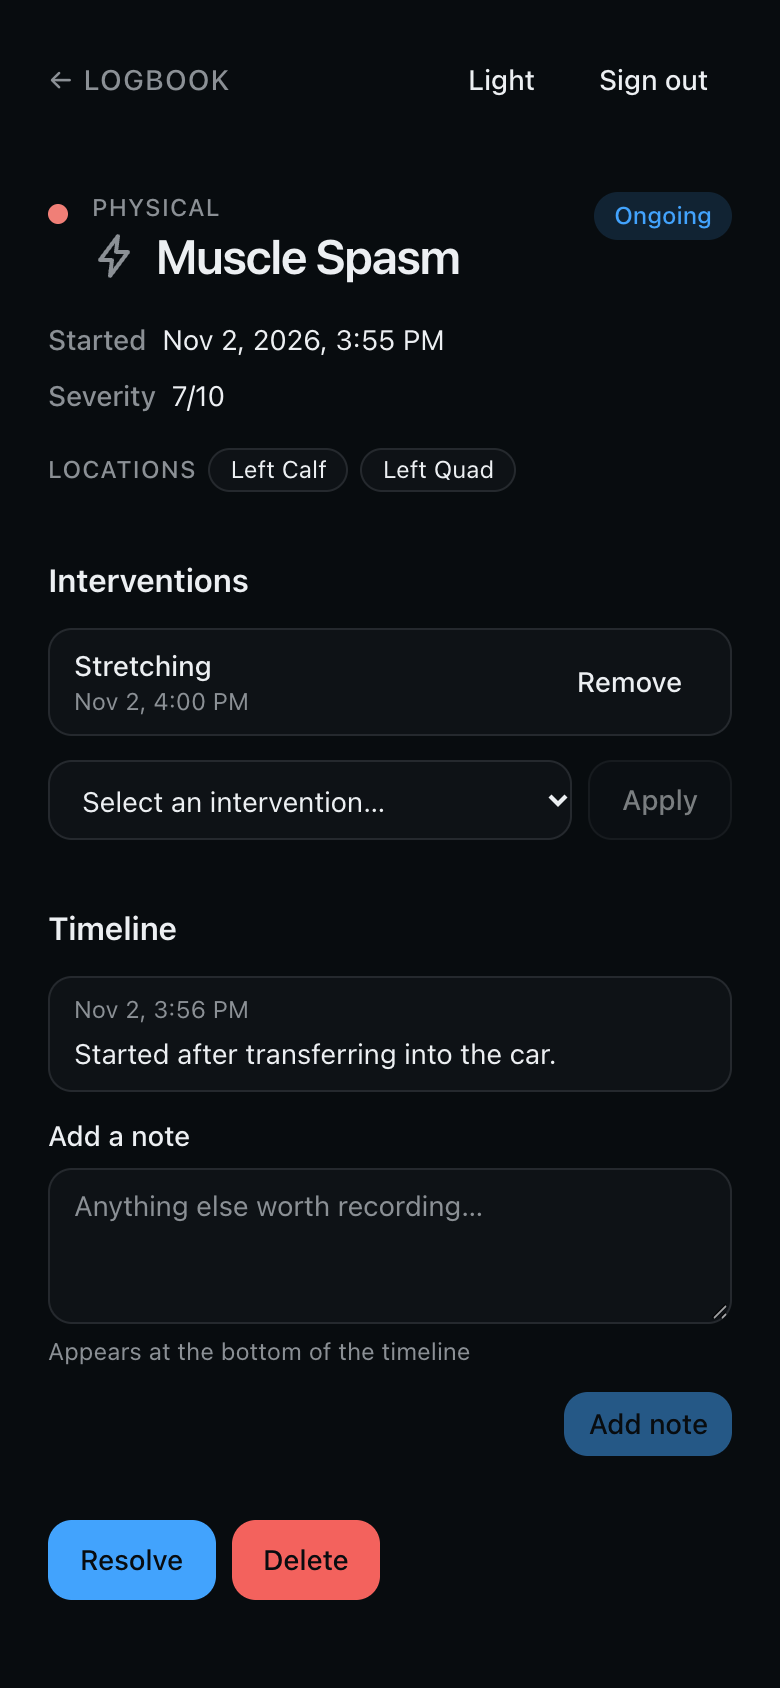
Tap an event to open it. From there you can:
- Apply an intervention, the thing you tried: stretching, heat, a position change, a breathing exercise, medication. Each one is timestamped. The list only offers interventions that fit the event type, so a muscle spasm suggests stretching and anxiety suggests grounding or deep breathing. General ones like Rest appear everywhere.
- Add a note at any time. Notes build up into a timeline.
- Resolve the event when it's over. That records the end time and the duration.
- Delete an event logged by mistake, after a confirmation.
The timeline
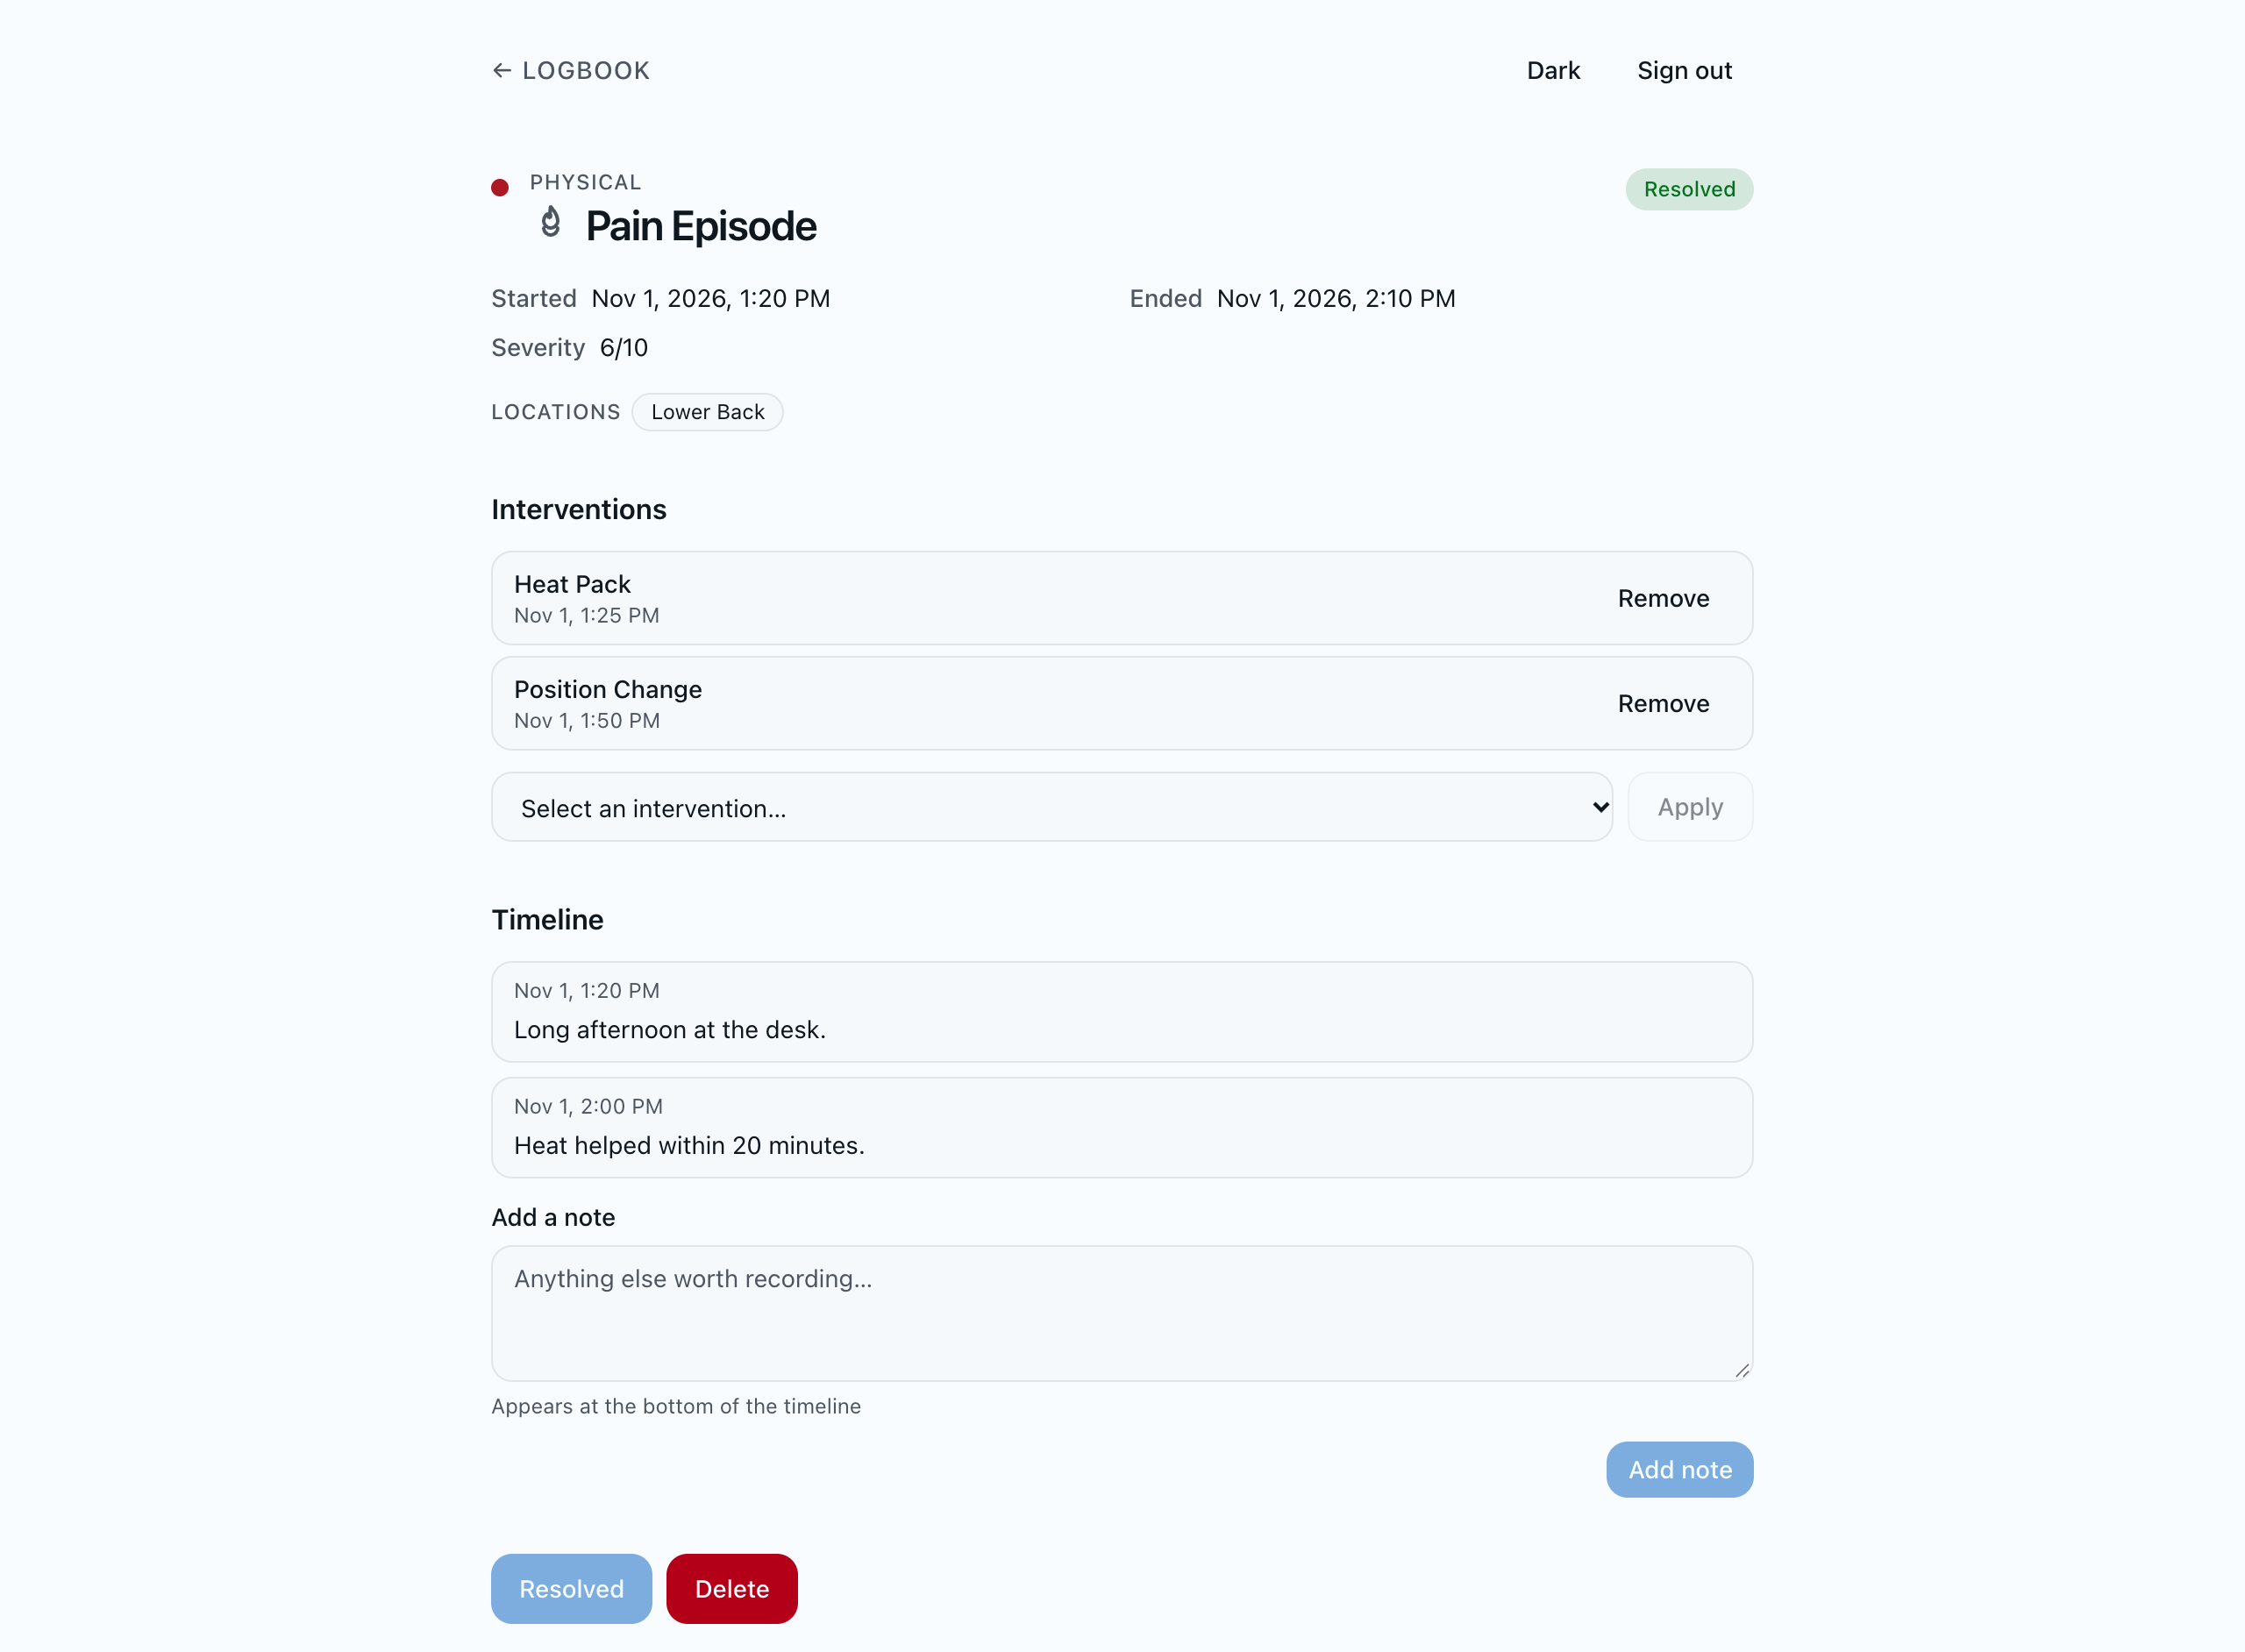
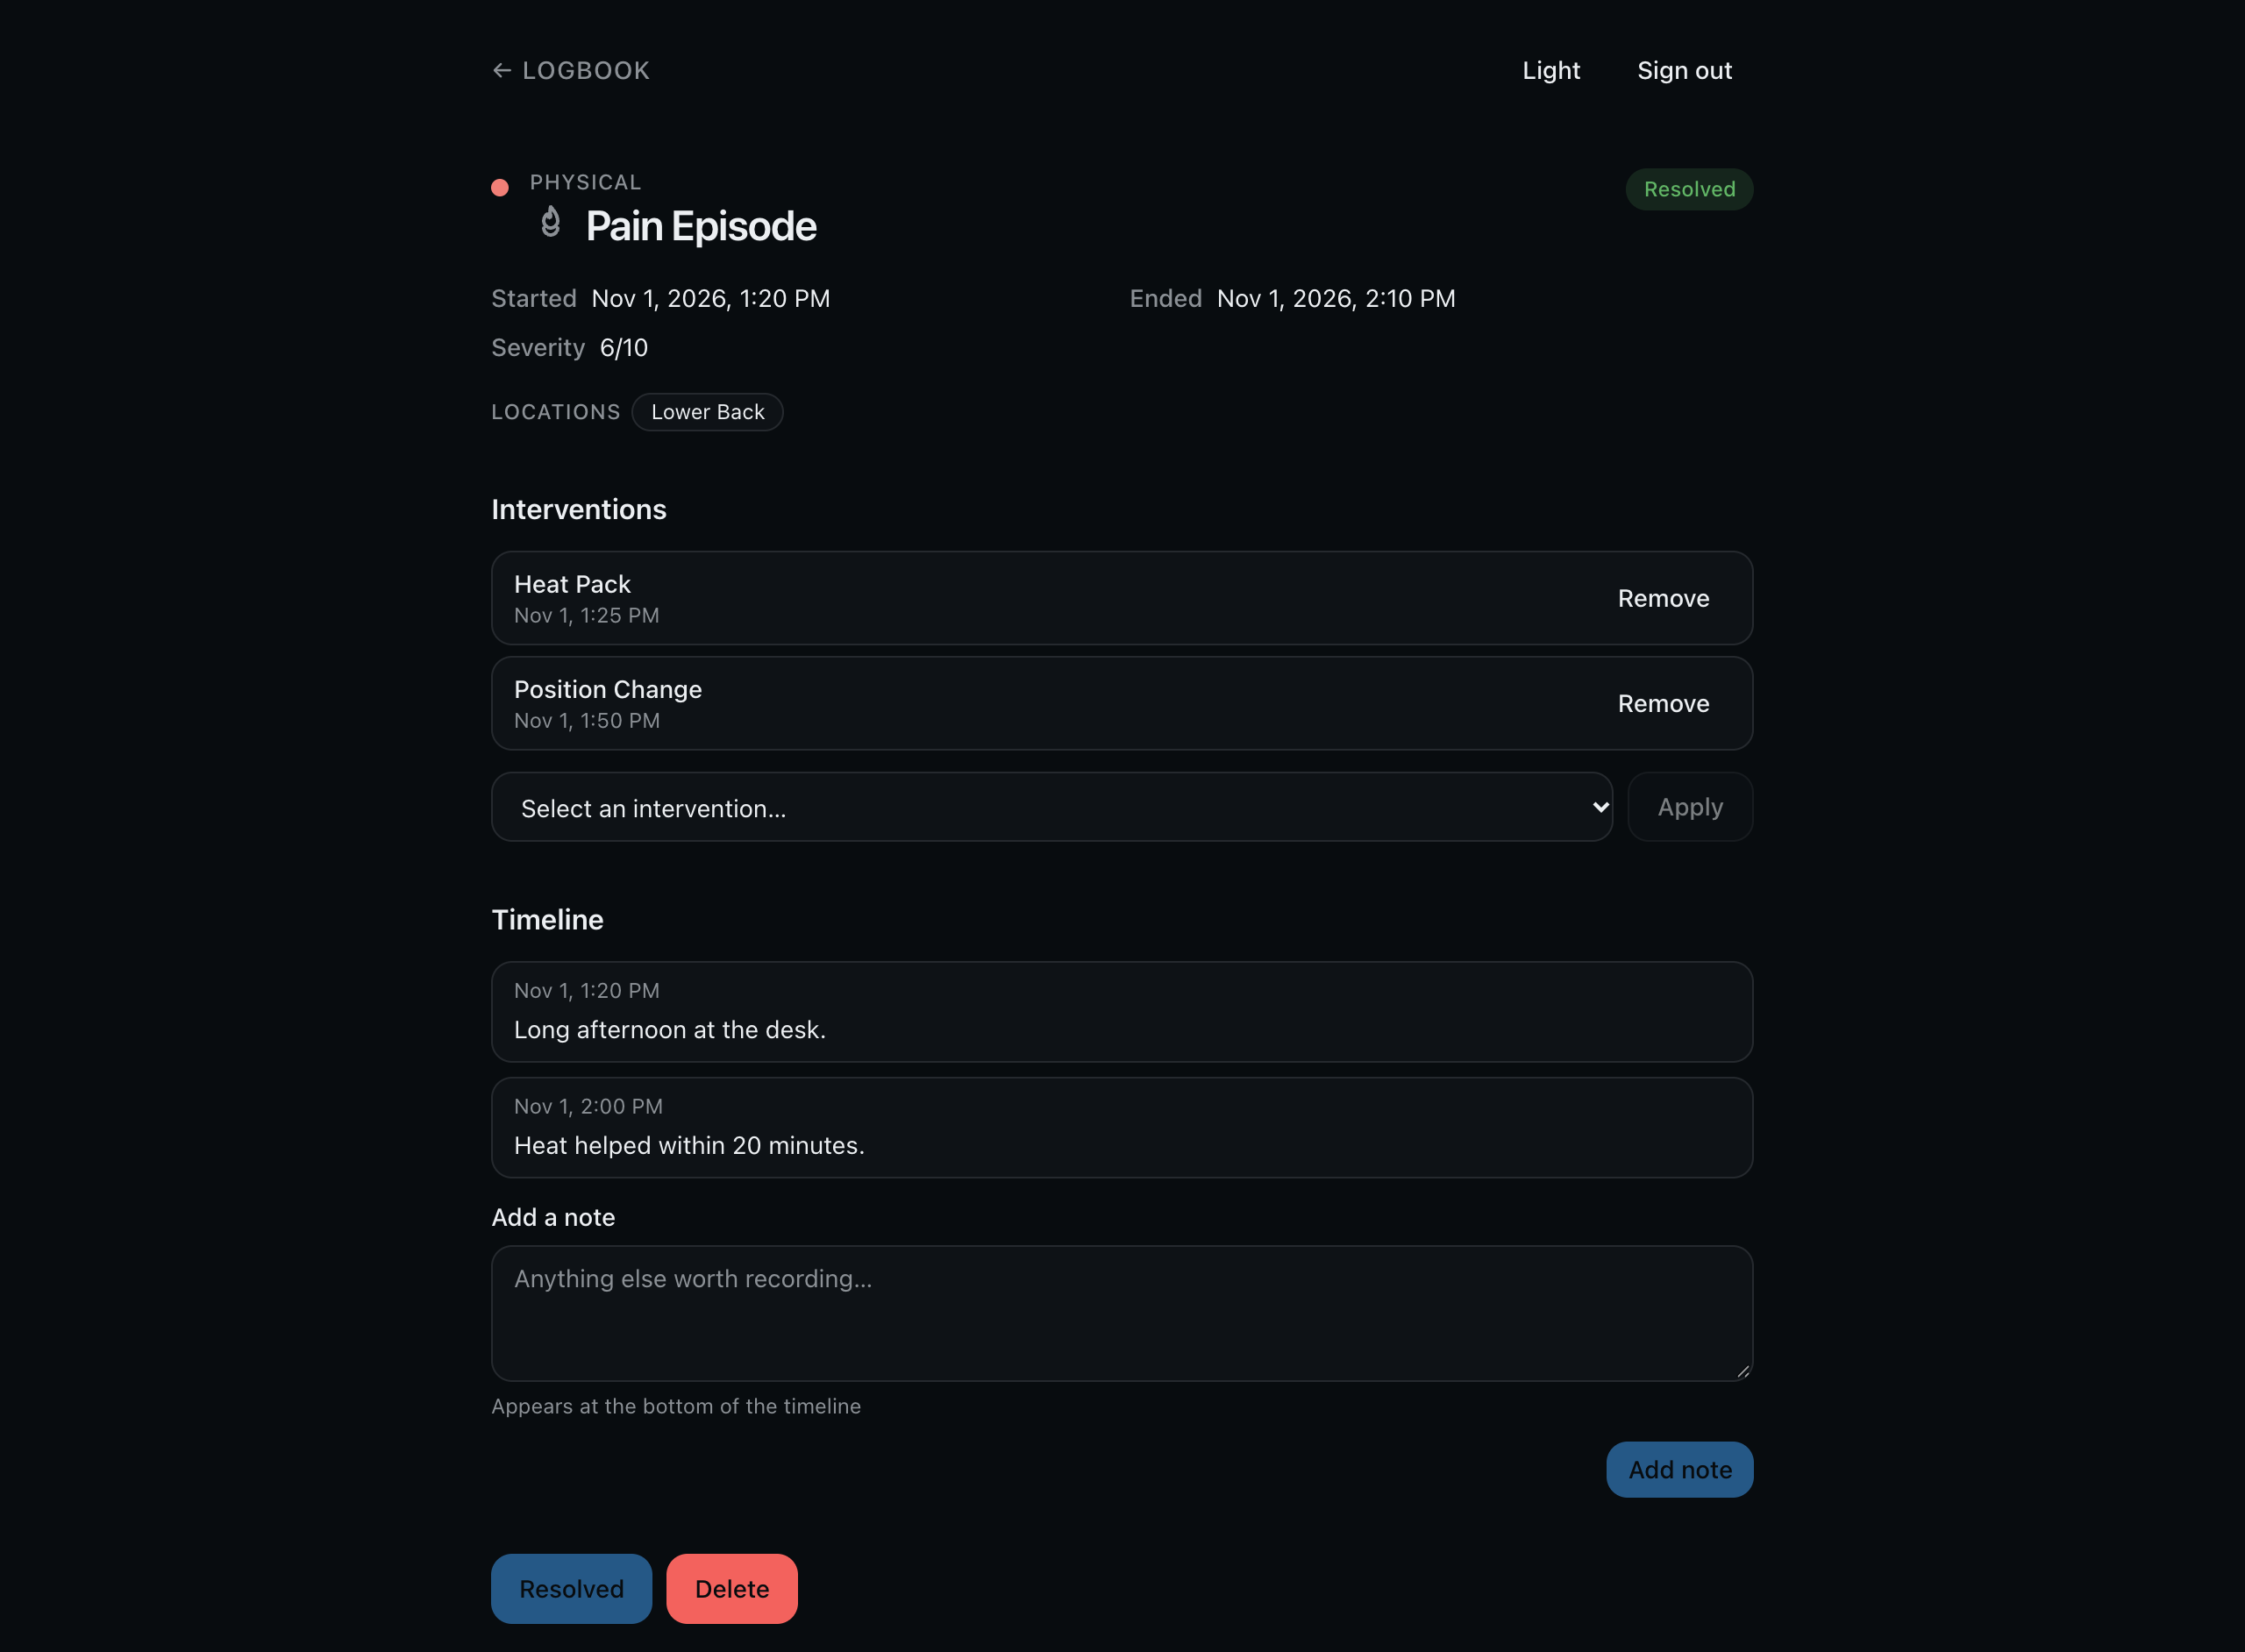
Every event keeps its whole story: when it started and ended, how bad it was, where, what was tried and when, and every note in order. This is the view to scroll through when someone asks what a bad day actually looked like.
History and CSV export
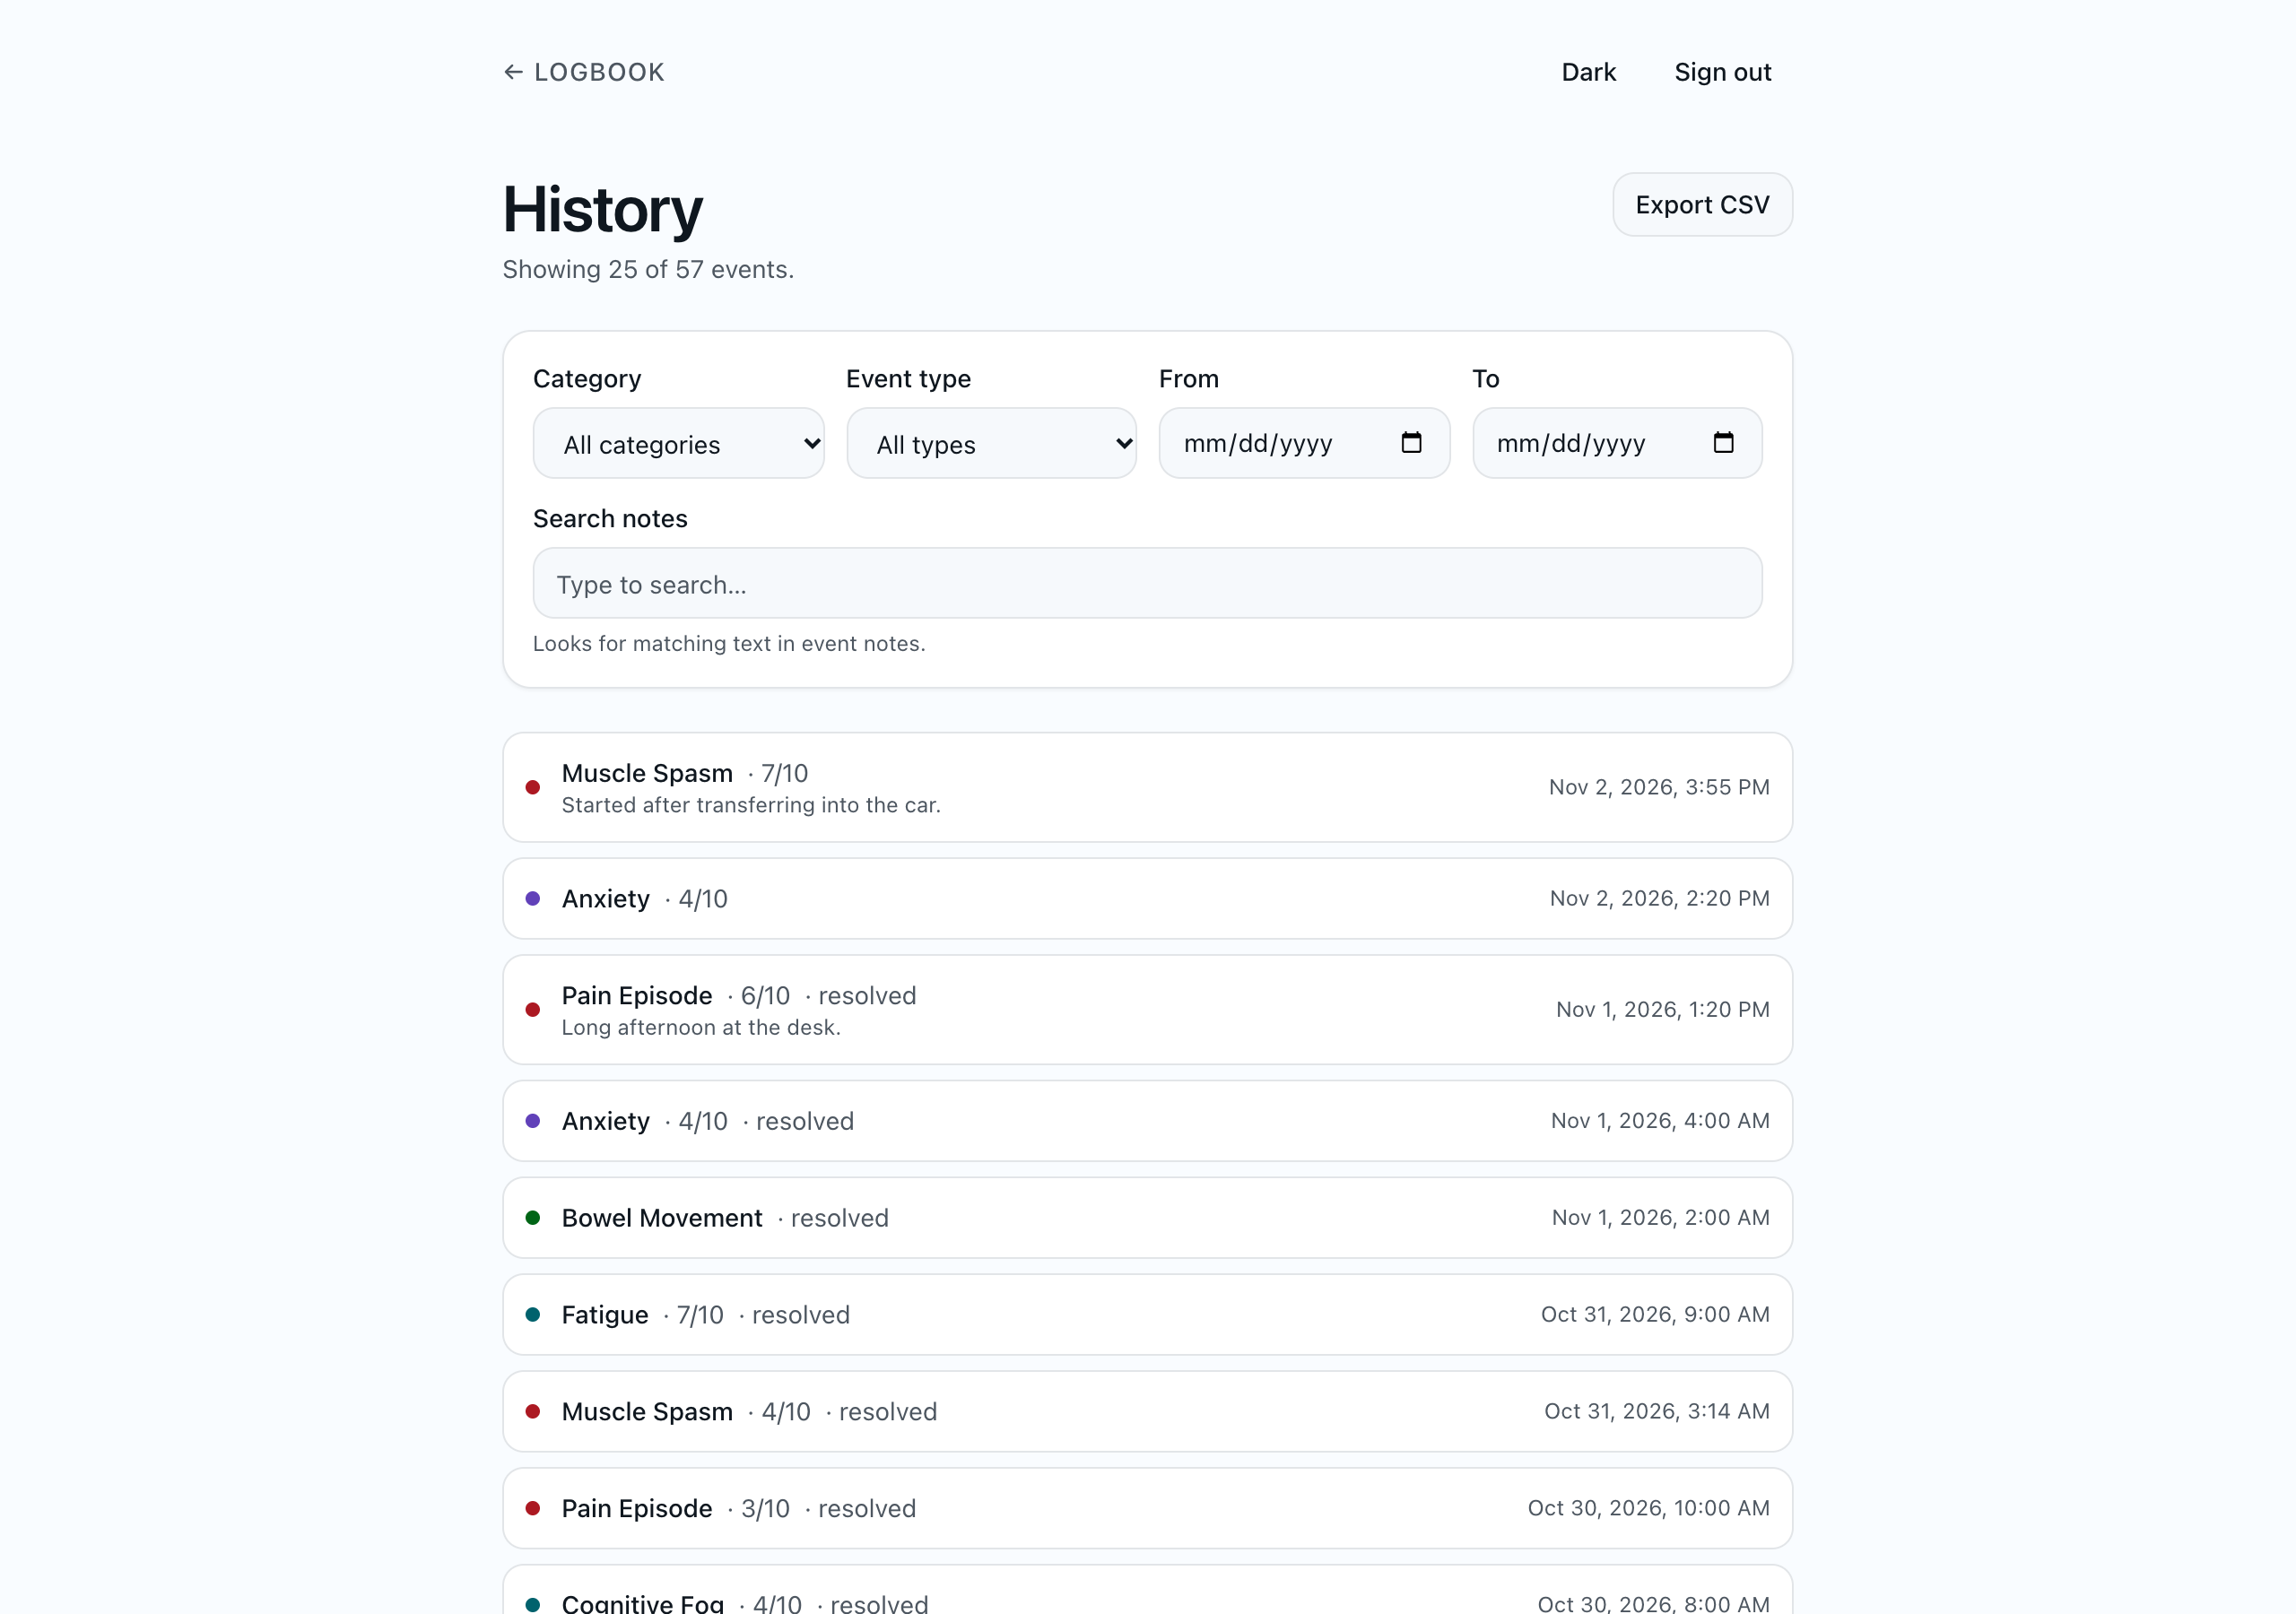
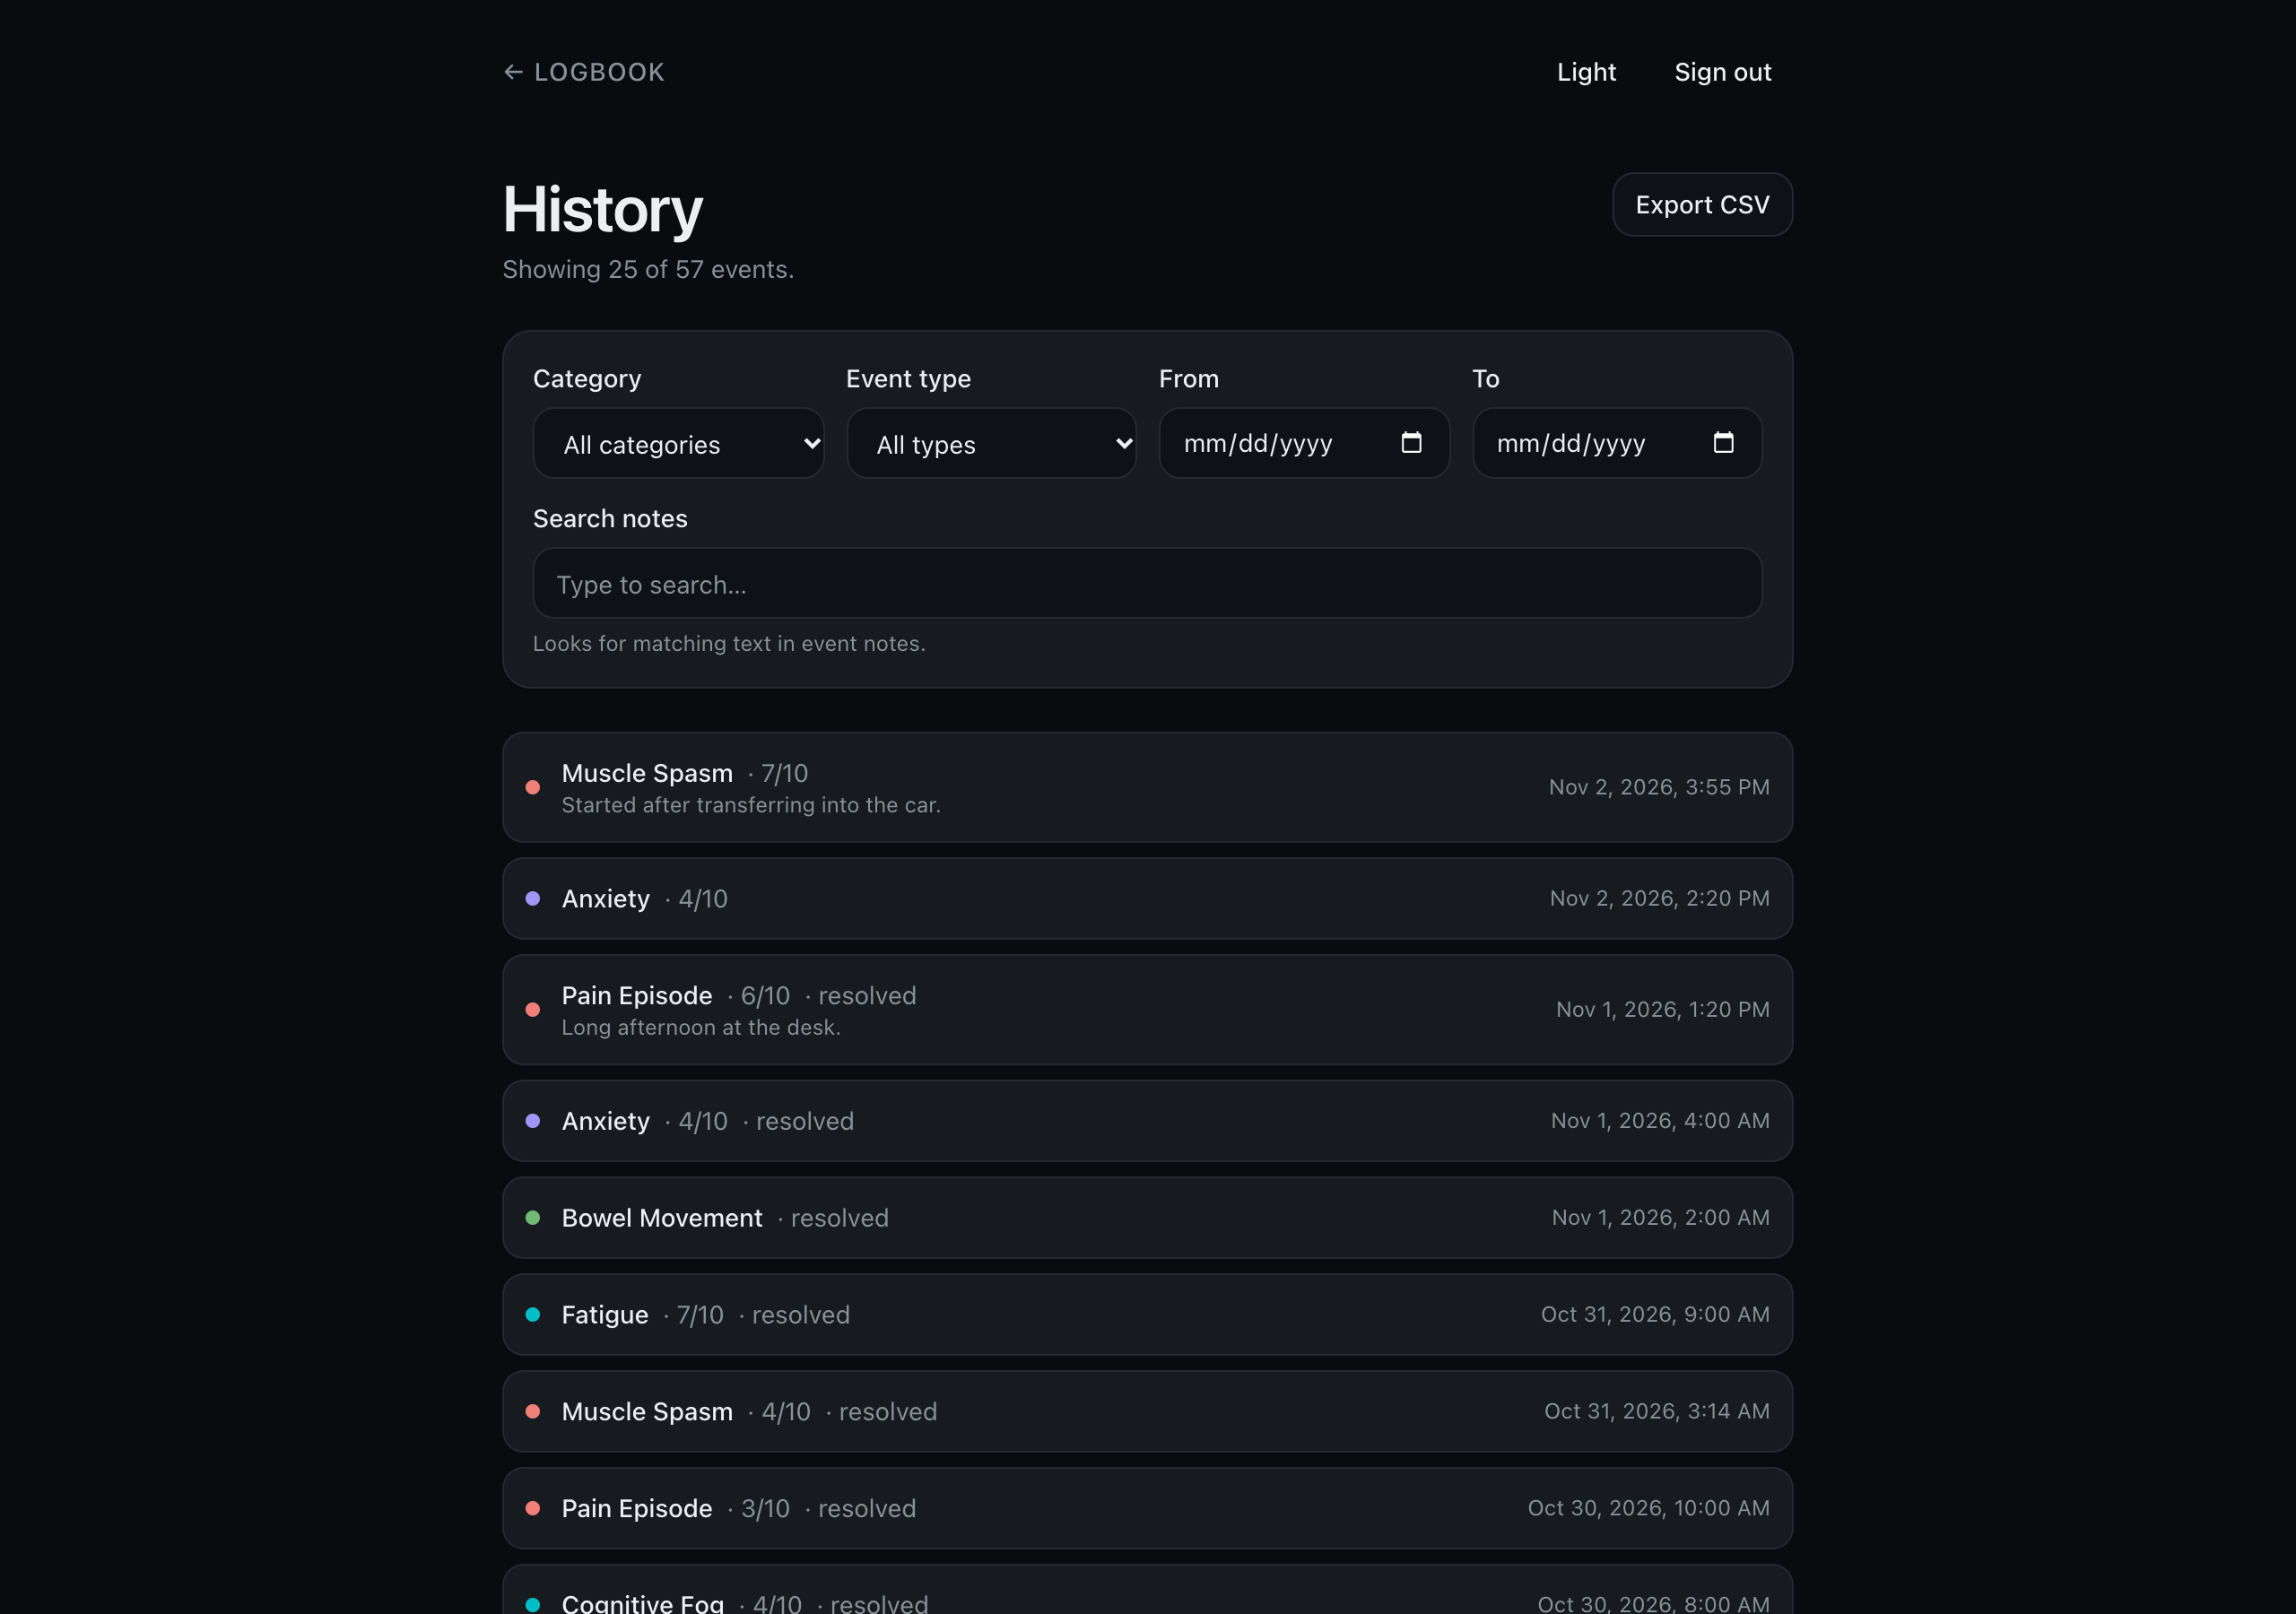
History lists everything, newest first. Narrow it down by category, event type and date range, or search your notes. Export CSV downloads exactly what you're looking at, ready for a spreadsheet.
Stats
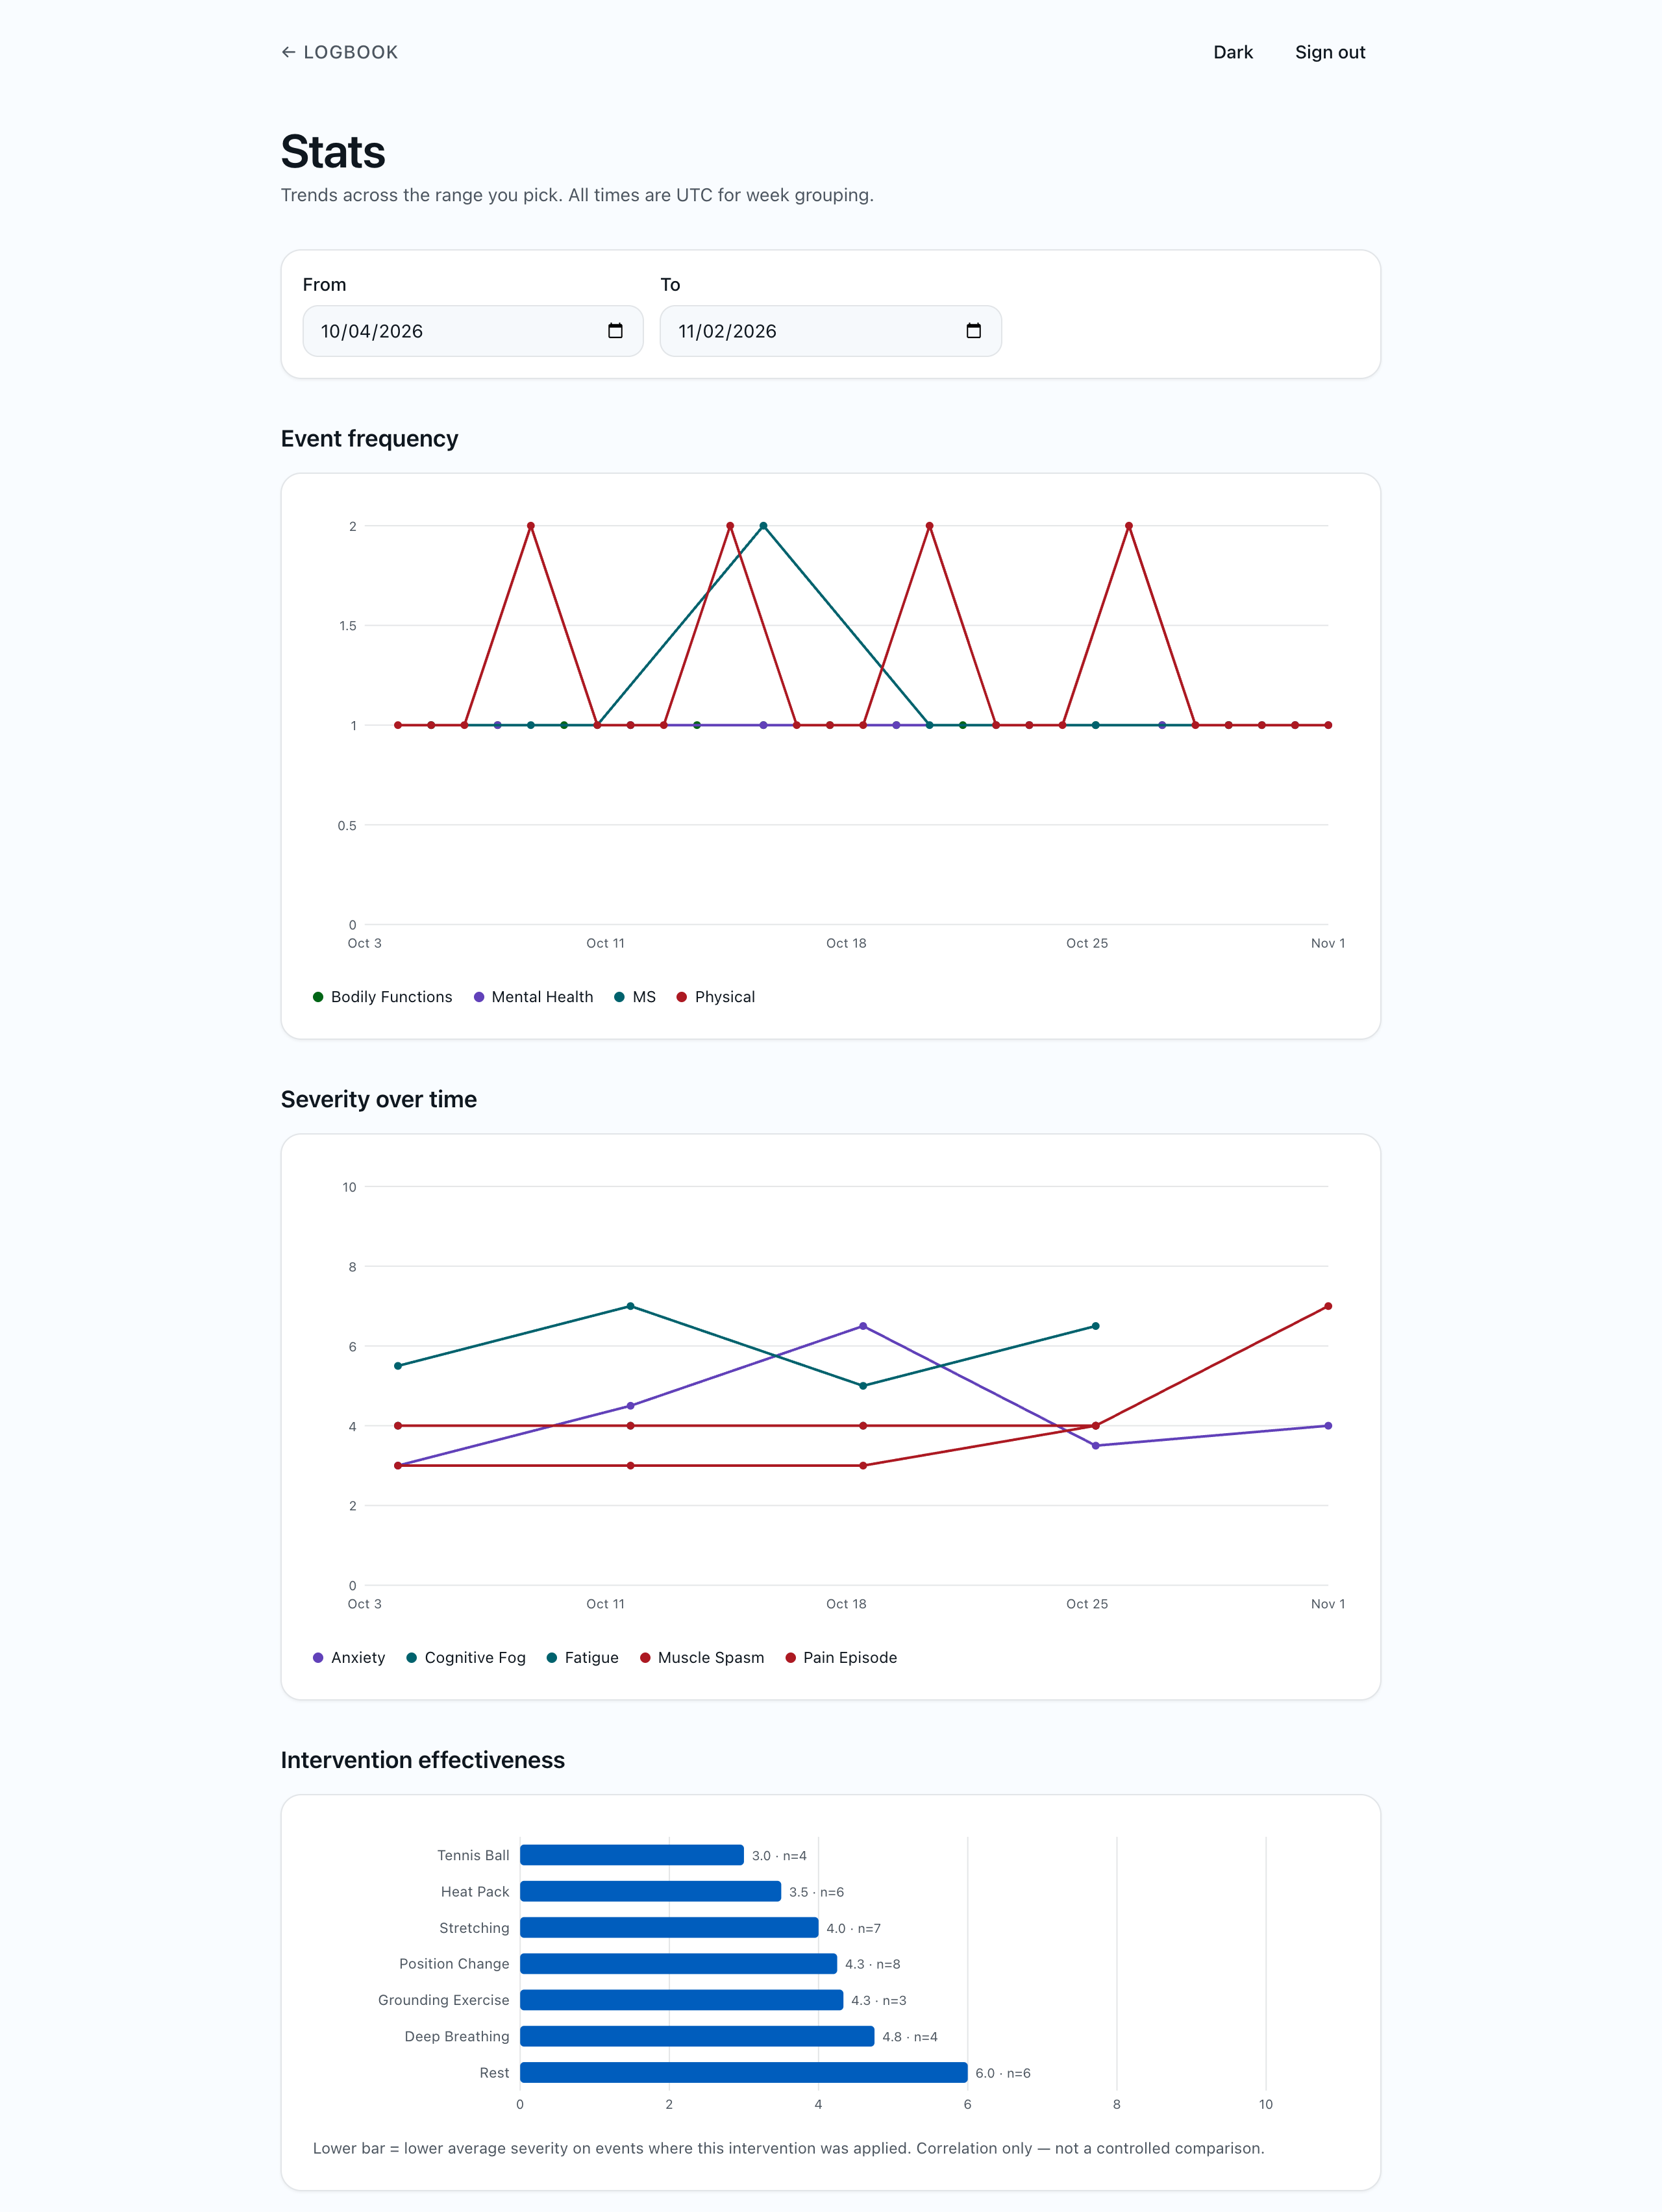
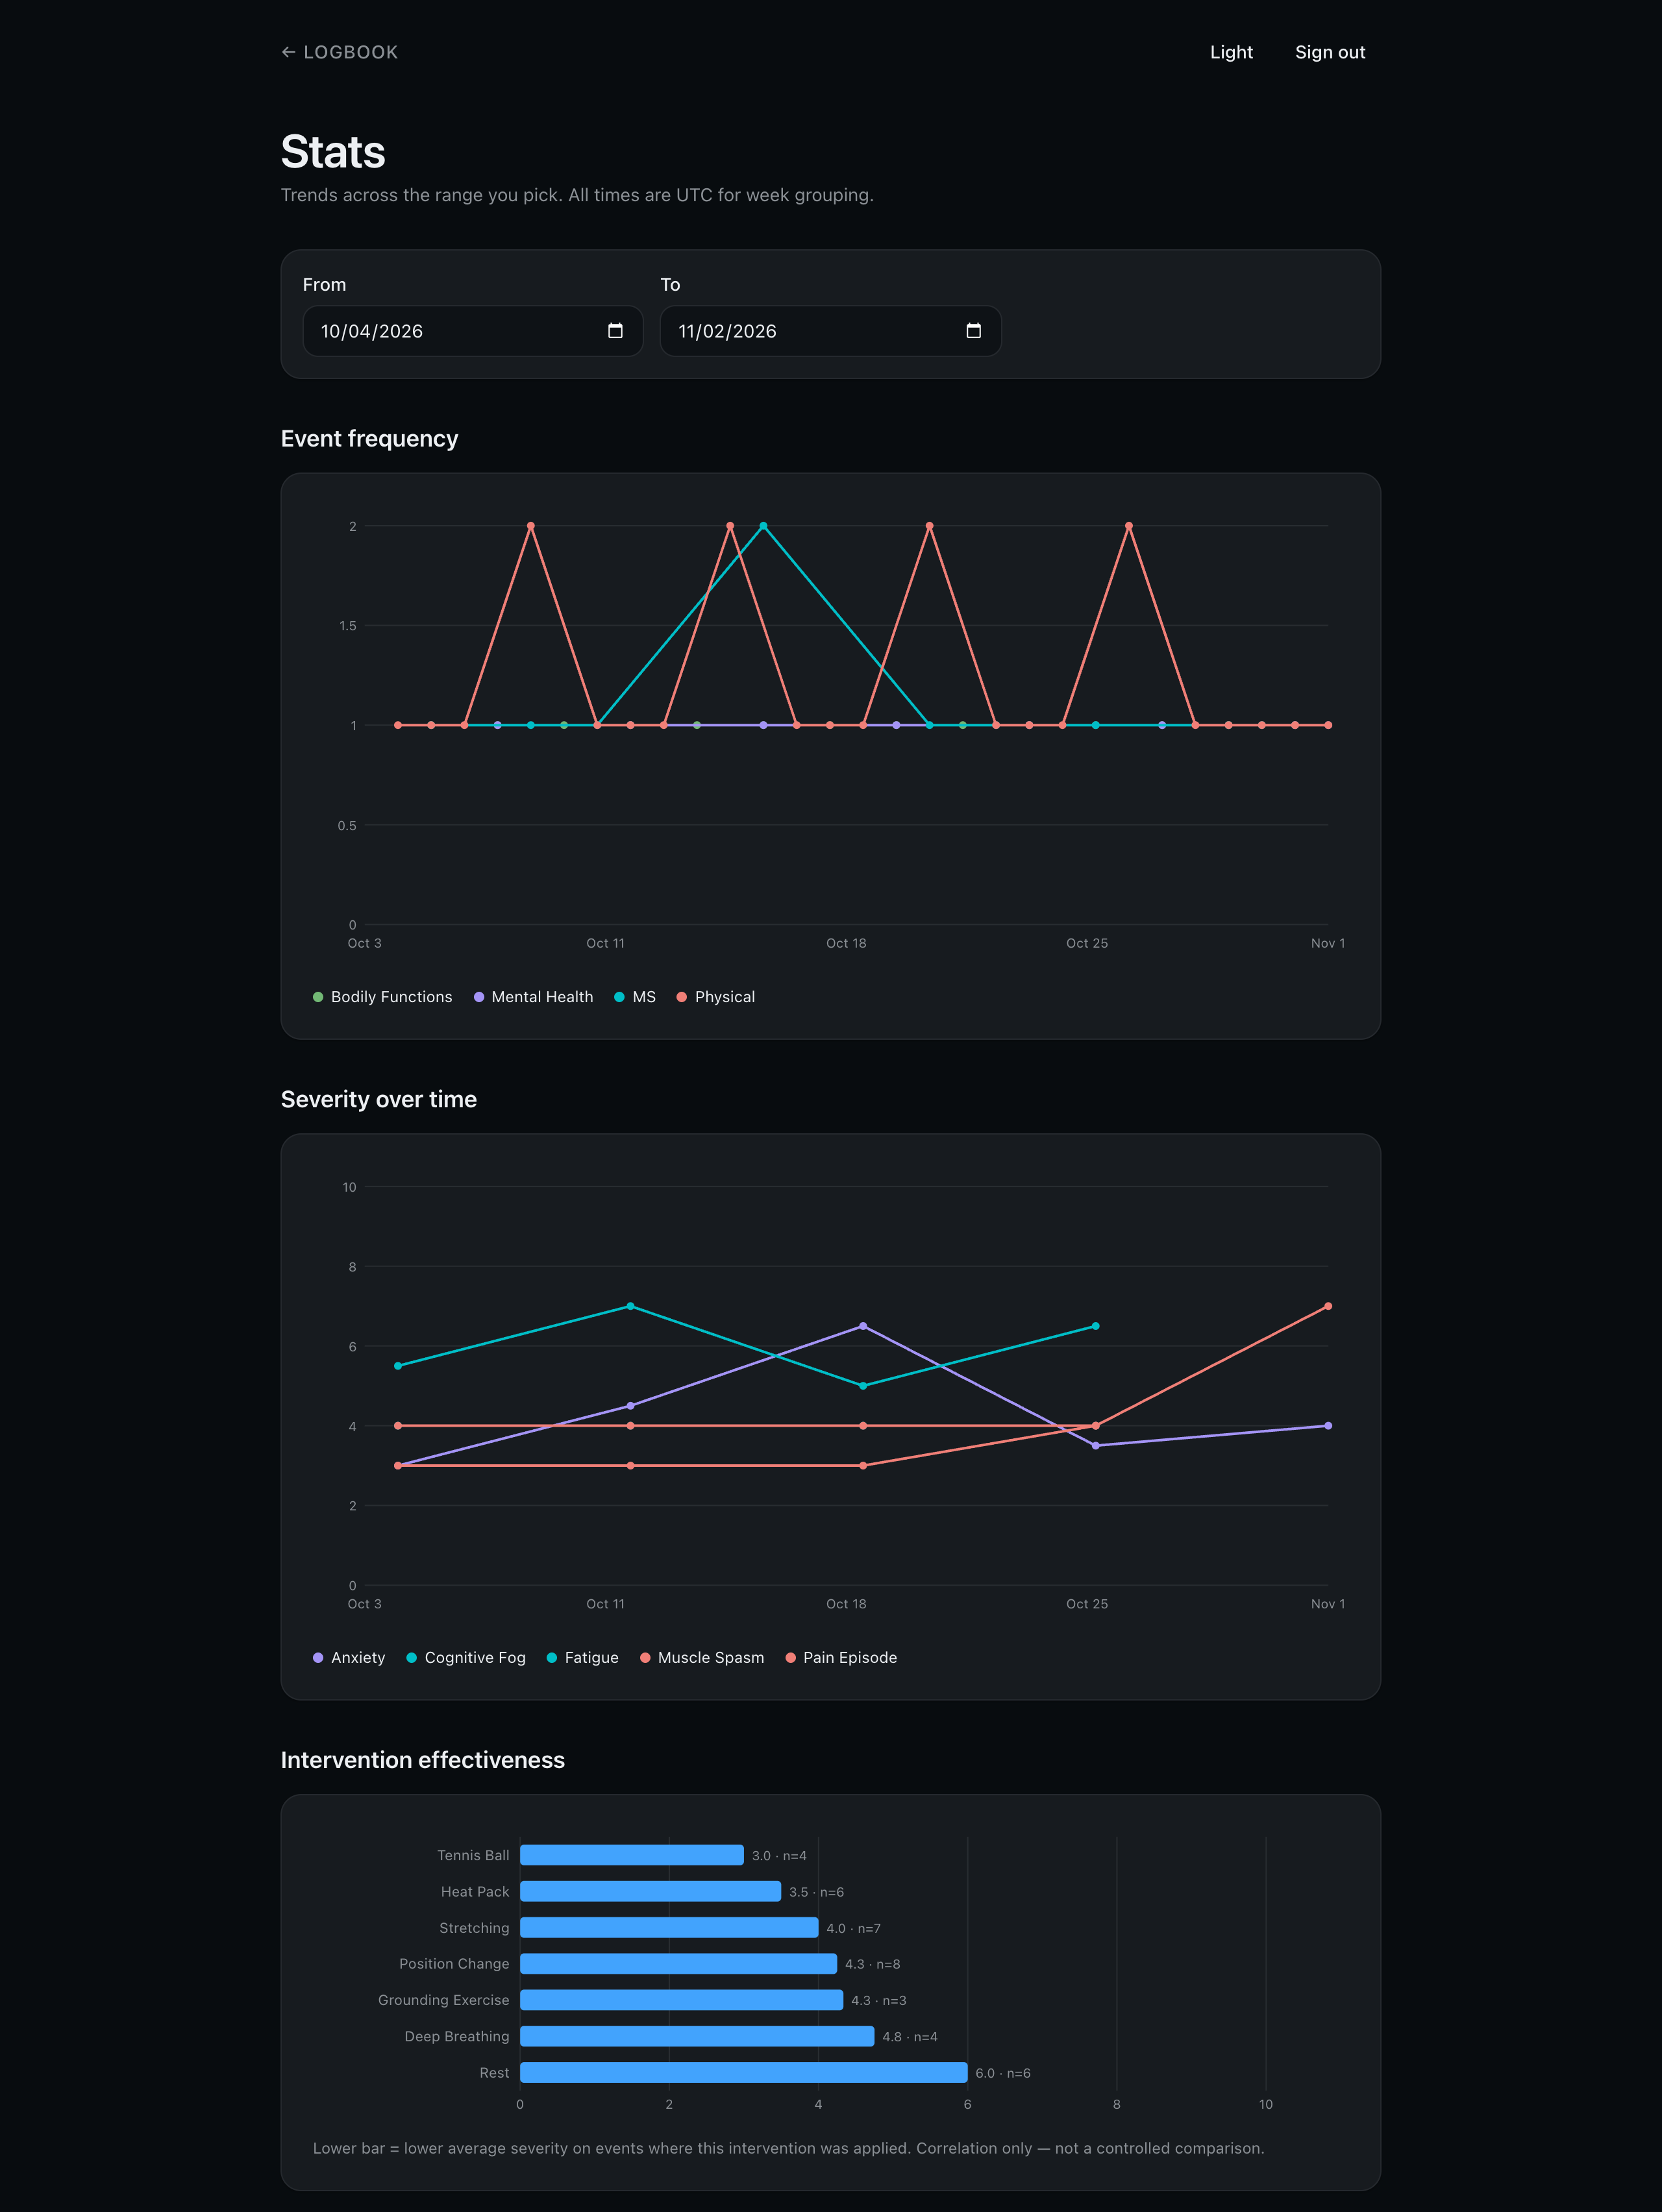
Pick a date range and see:
- Event frequency: how often each category shows up, day by day.
- Severity over time: the weekly average for each event type.
- Intervention effectiveness: the average severity of events where each intervention was used, with the number of events behind it. Lower is better.
Correlation, not proof
The intervention chart shows what tended to go together, not what caused what. It's a starting point for a conversation with your care team, not a conclusion.
A report for appointments
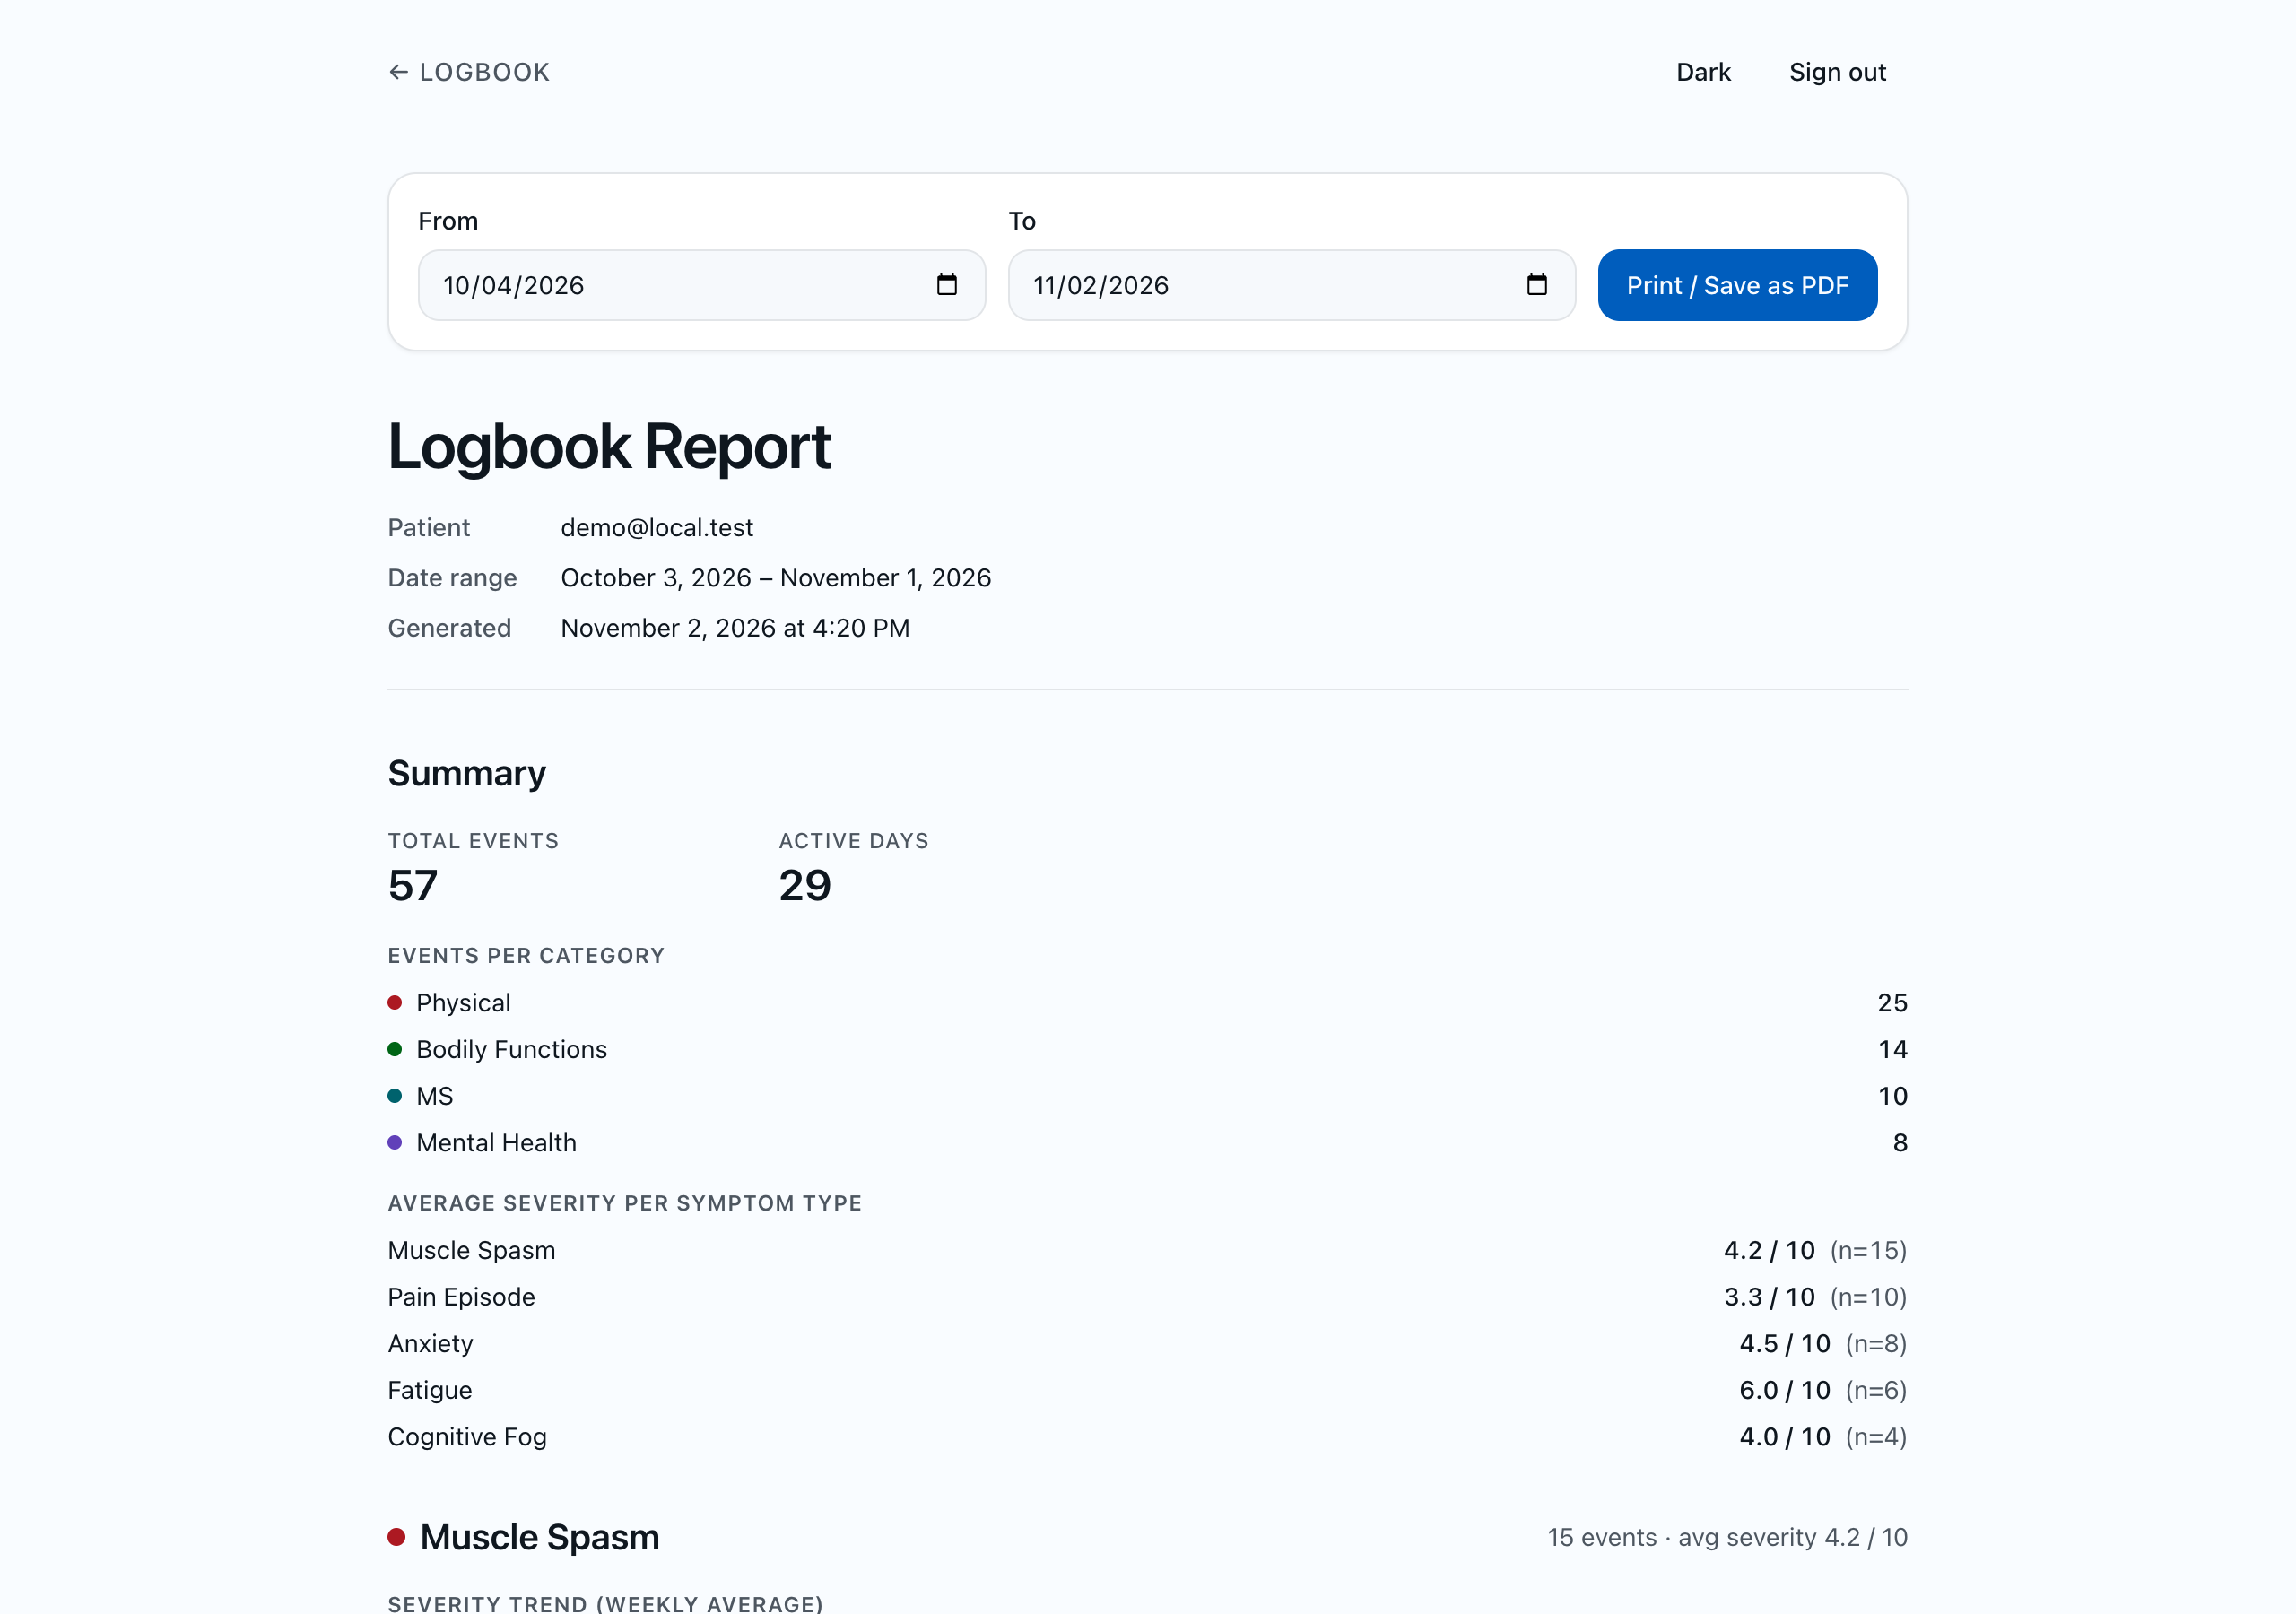
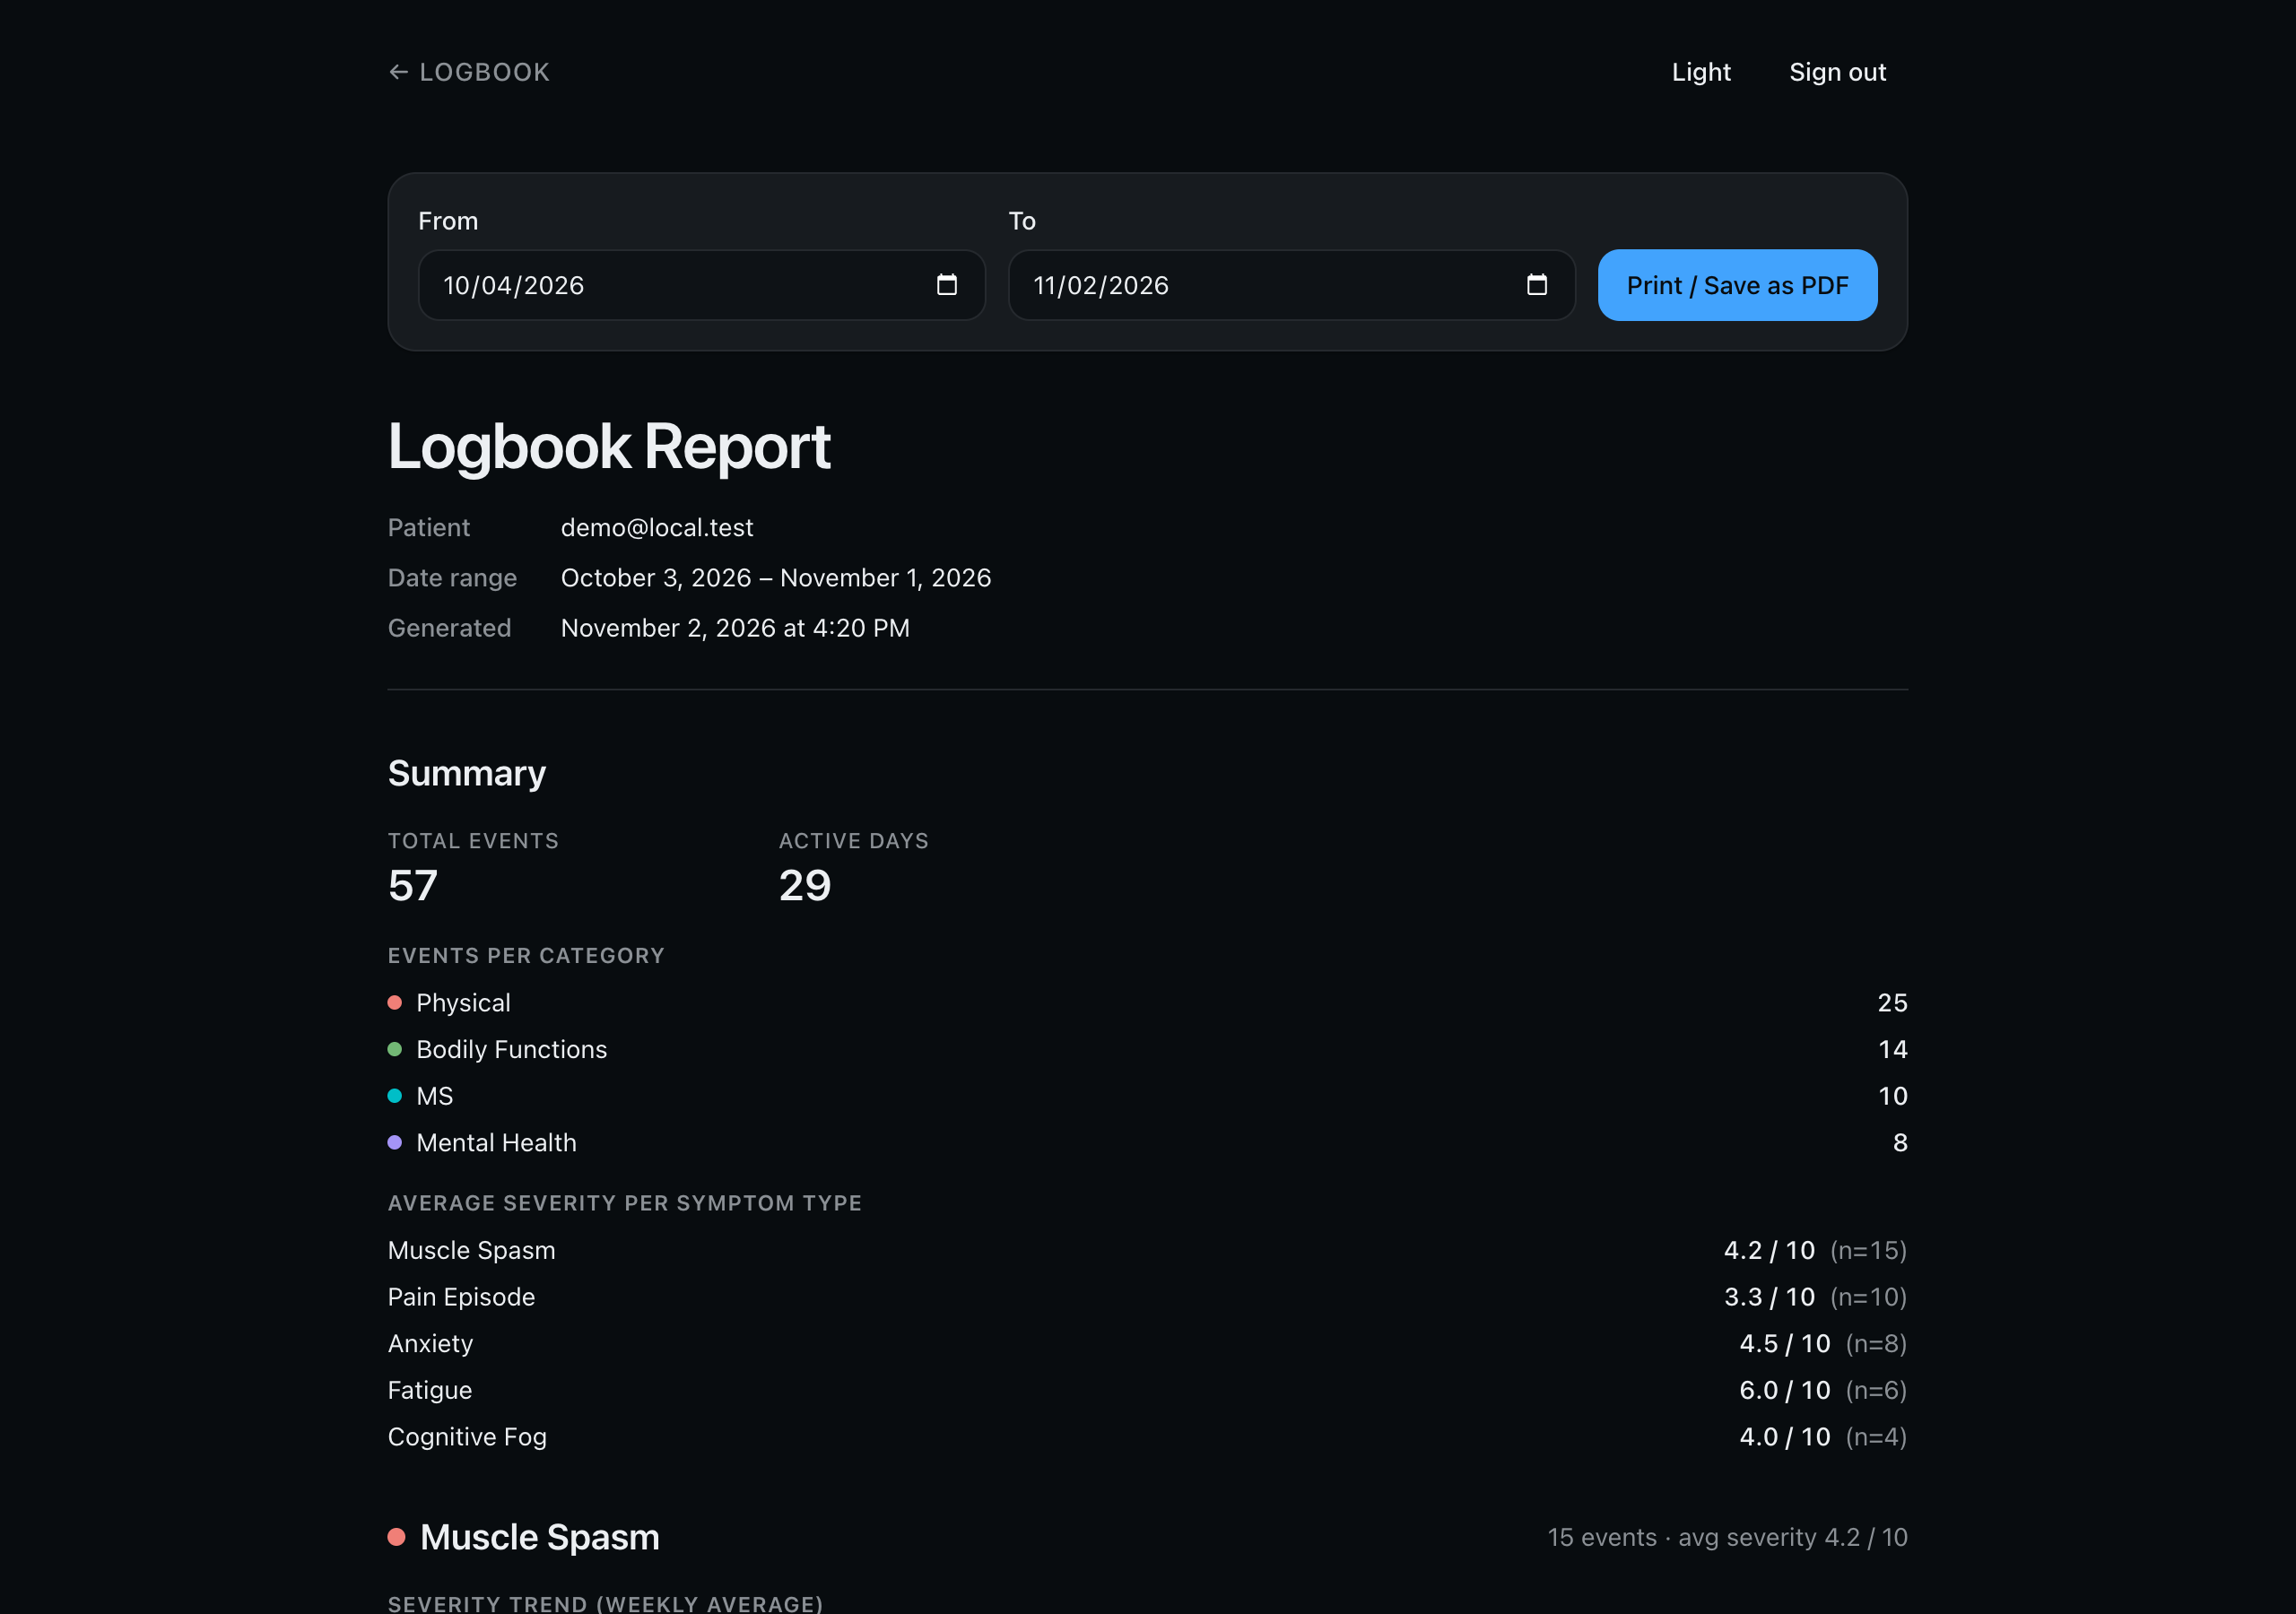
Report turns a date range (90 days by default) into a handout for a doctor, therapist or specialist:
- Cover: who, which dates, and when it was generated.
- Summary: total events, days with at least one event, events per category and average severity per type.
- One section per event type: count, a severity trend chart, where it happened (as a body-location heatmap) and the most used interventions.
- Notes appendix: every note, in date order.
Print / Save as PDF uses the browser's own print dialog. A print stylesheet removes the app's navigation, sets page margins and starts each section on a new page, so the PDF reads like a document, not a screenshot.
Make it yours
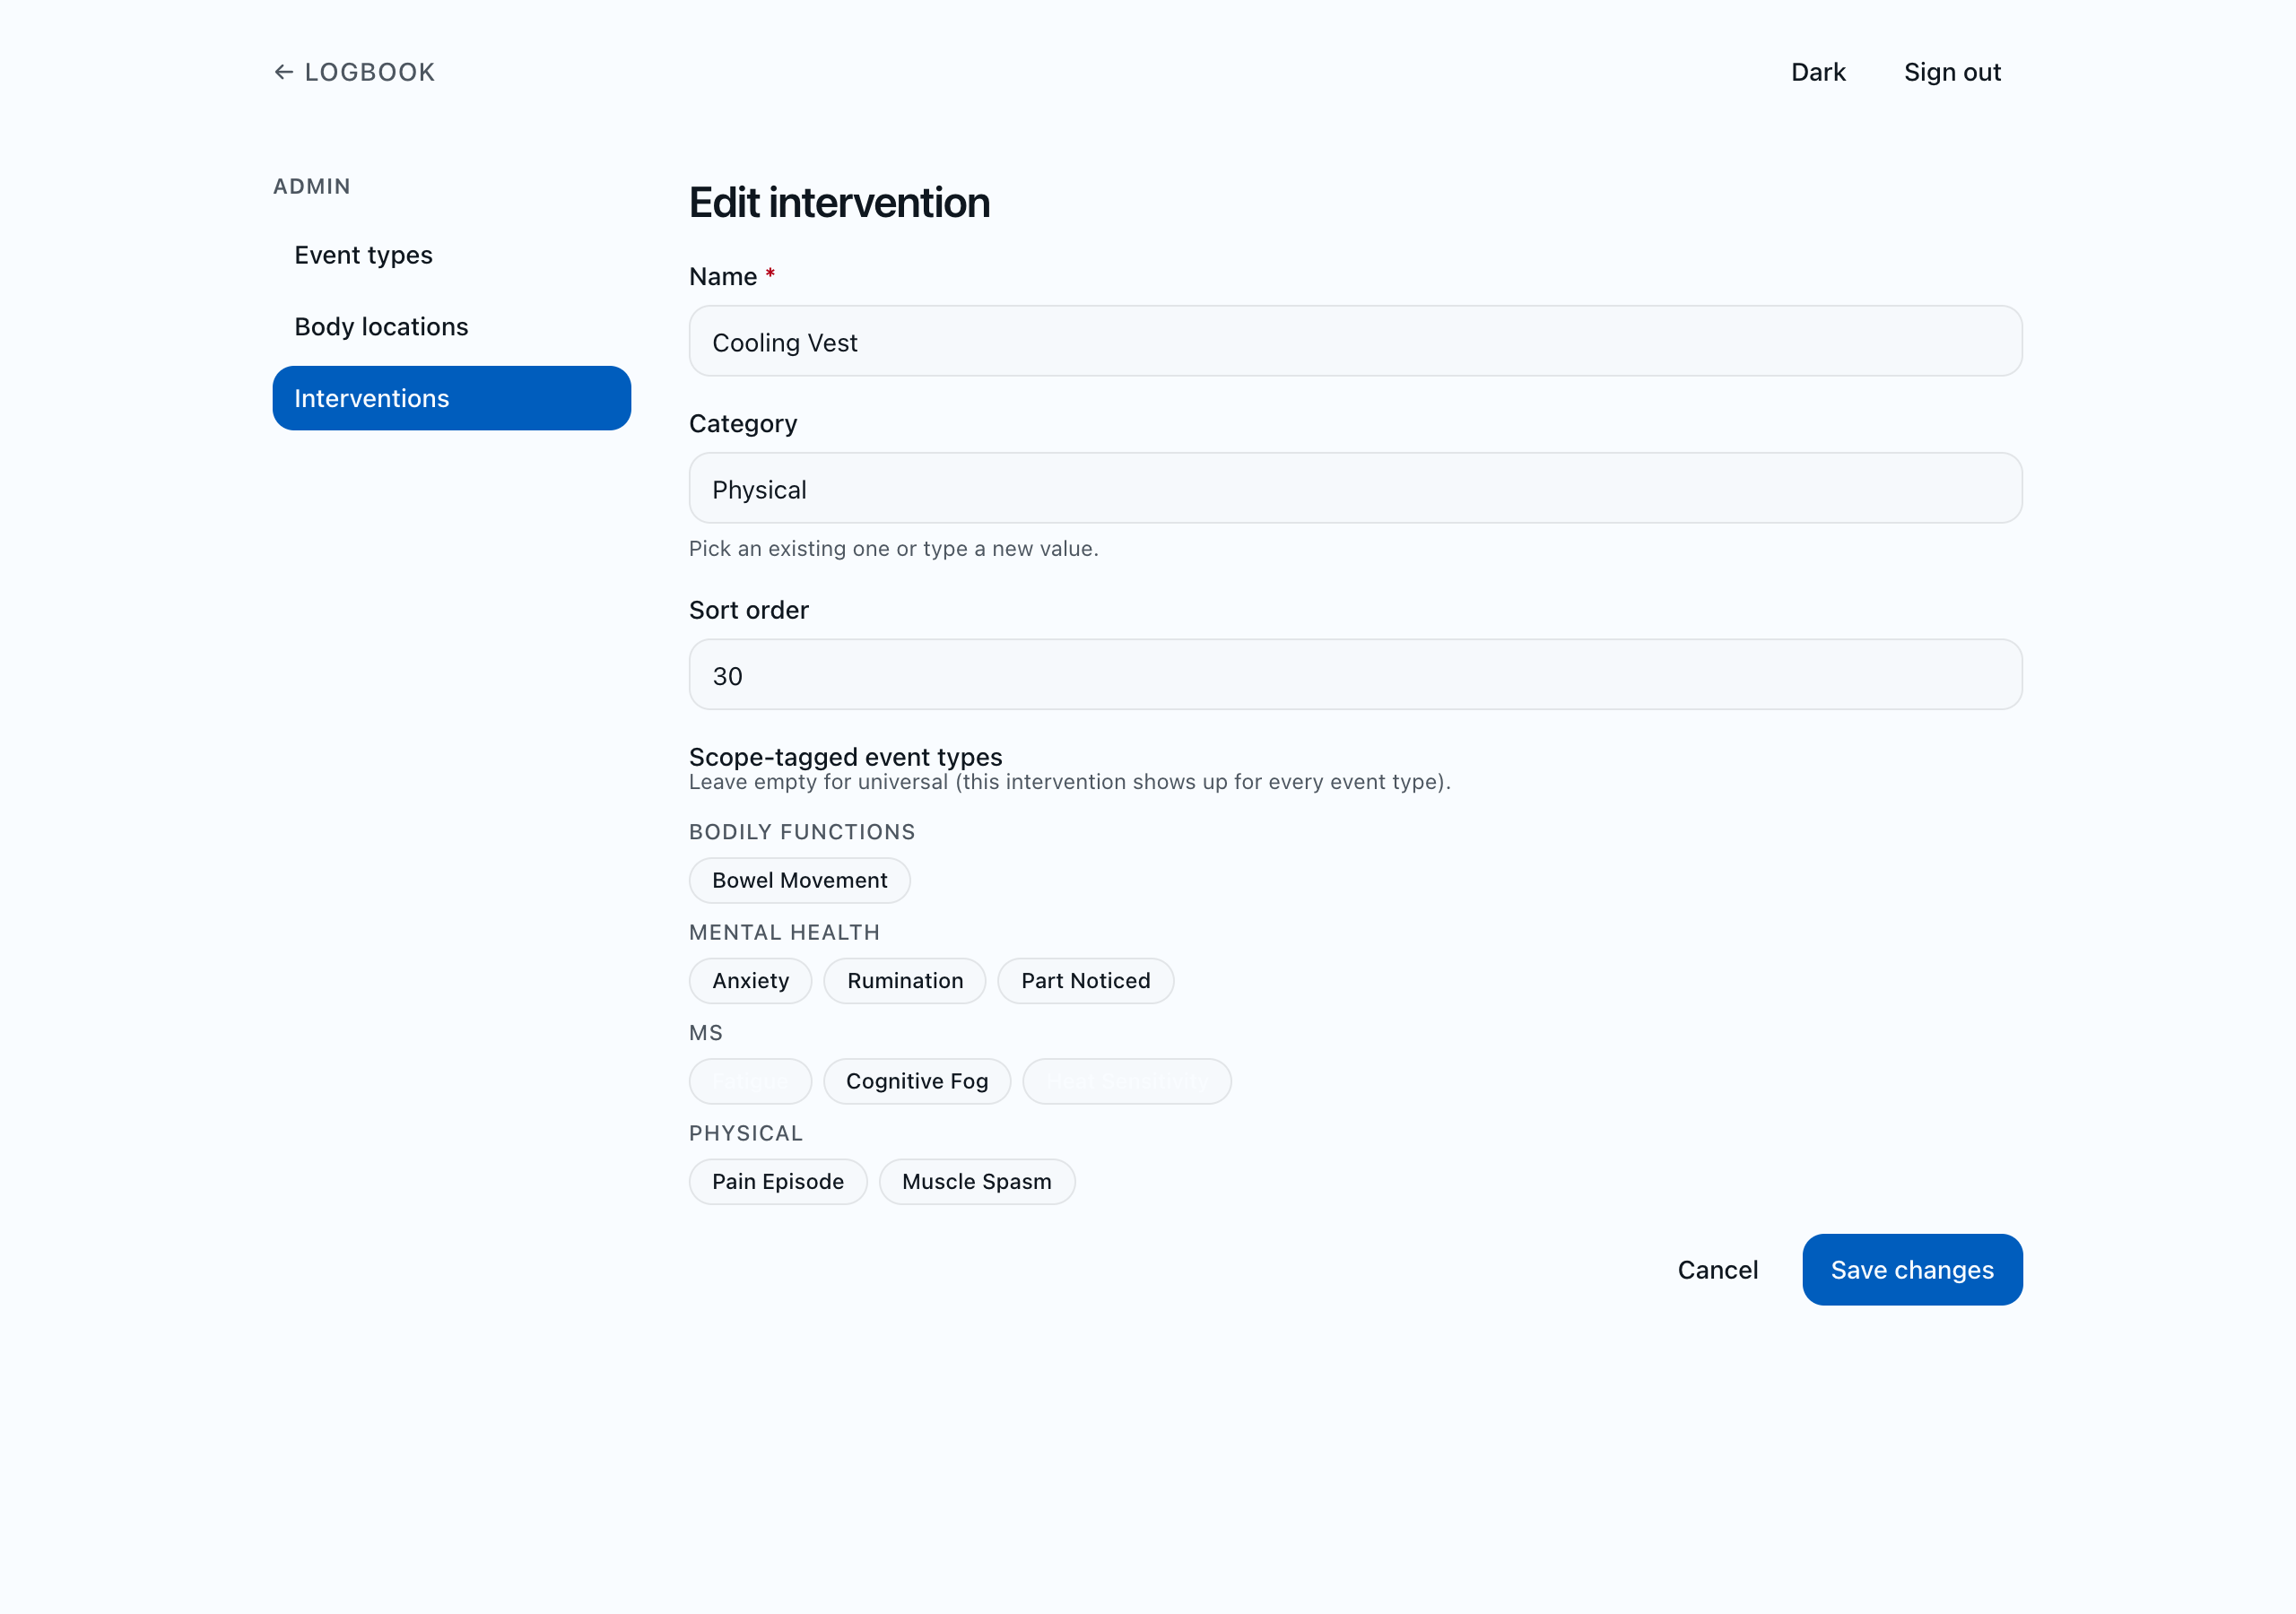
The Admin area manages the lists everything else is built from:
- Event types
- Name, category and icon, and whether the type asks for severity, body location and duration, or resolves itself when logged.
- Body locations
- Grouped by region. Add the ones you need.
- Interventions
- Grouped by category, and optionally scoped to the event types they belong to. Leave the scope empty and an intervention appears for every type. The same scope can be set from either side, on the event type or on the intervention.
The built-in defaults (marked Default) can be edited or removed like anything else.
Light and dark
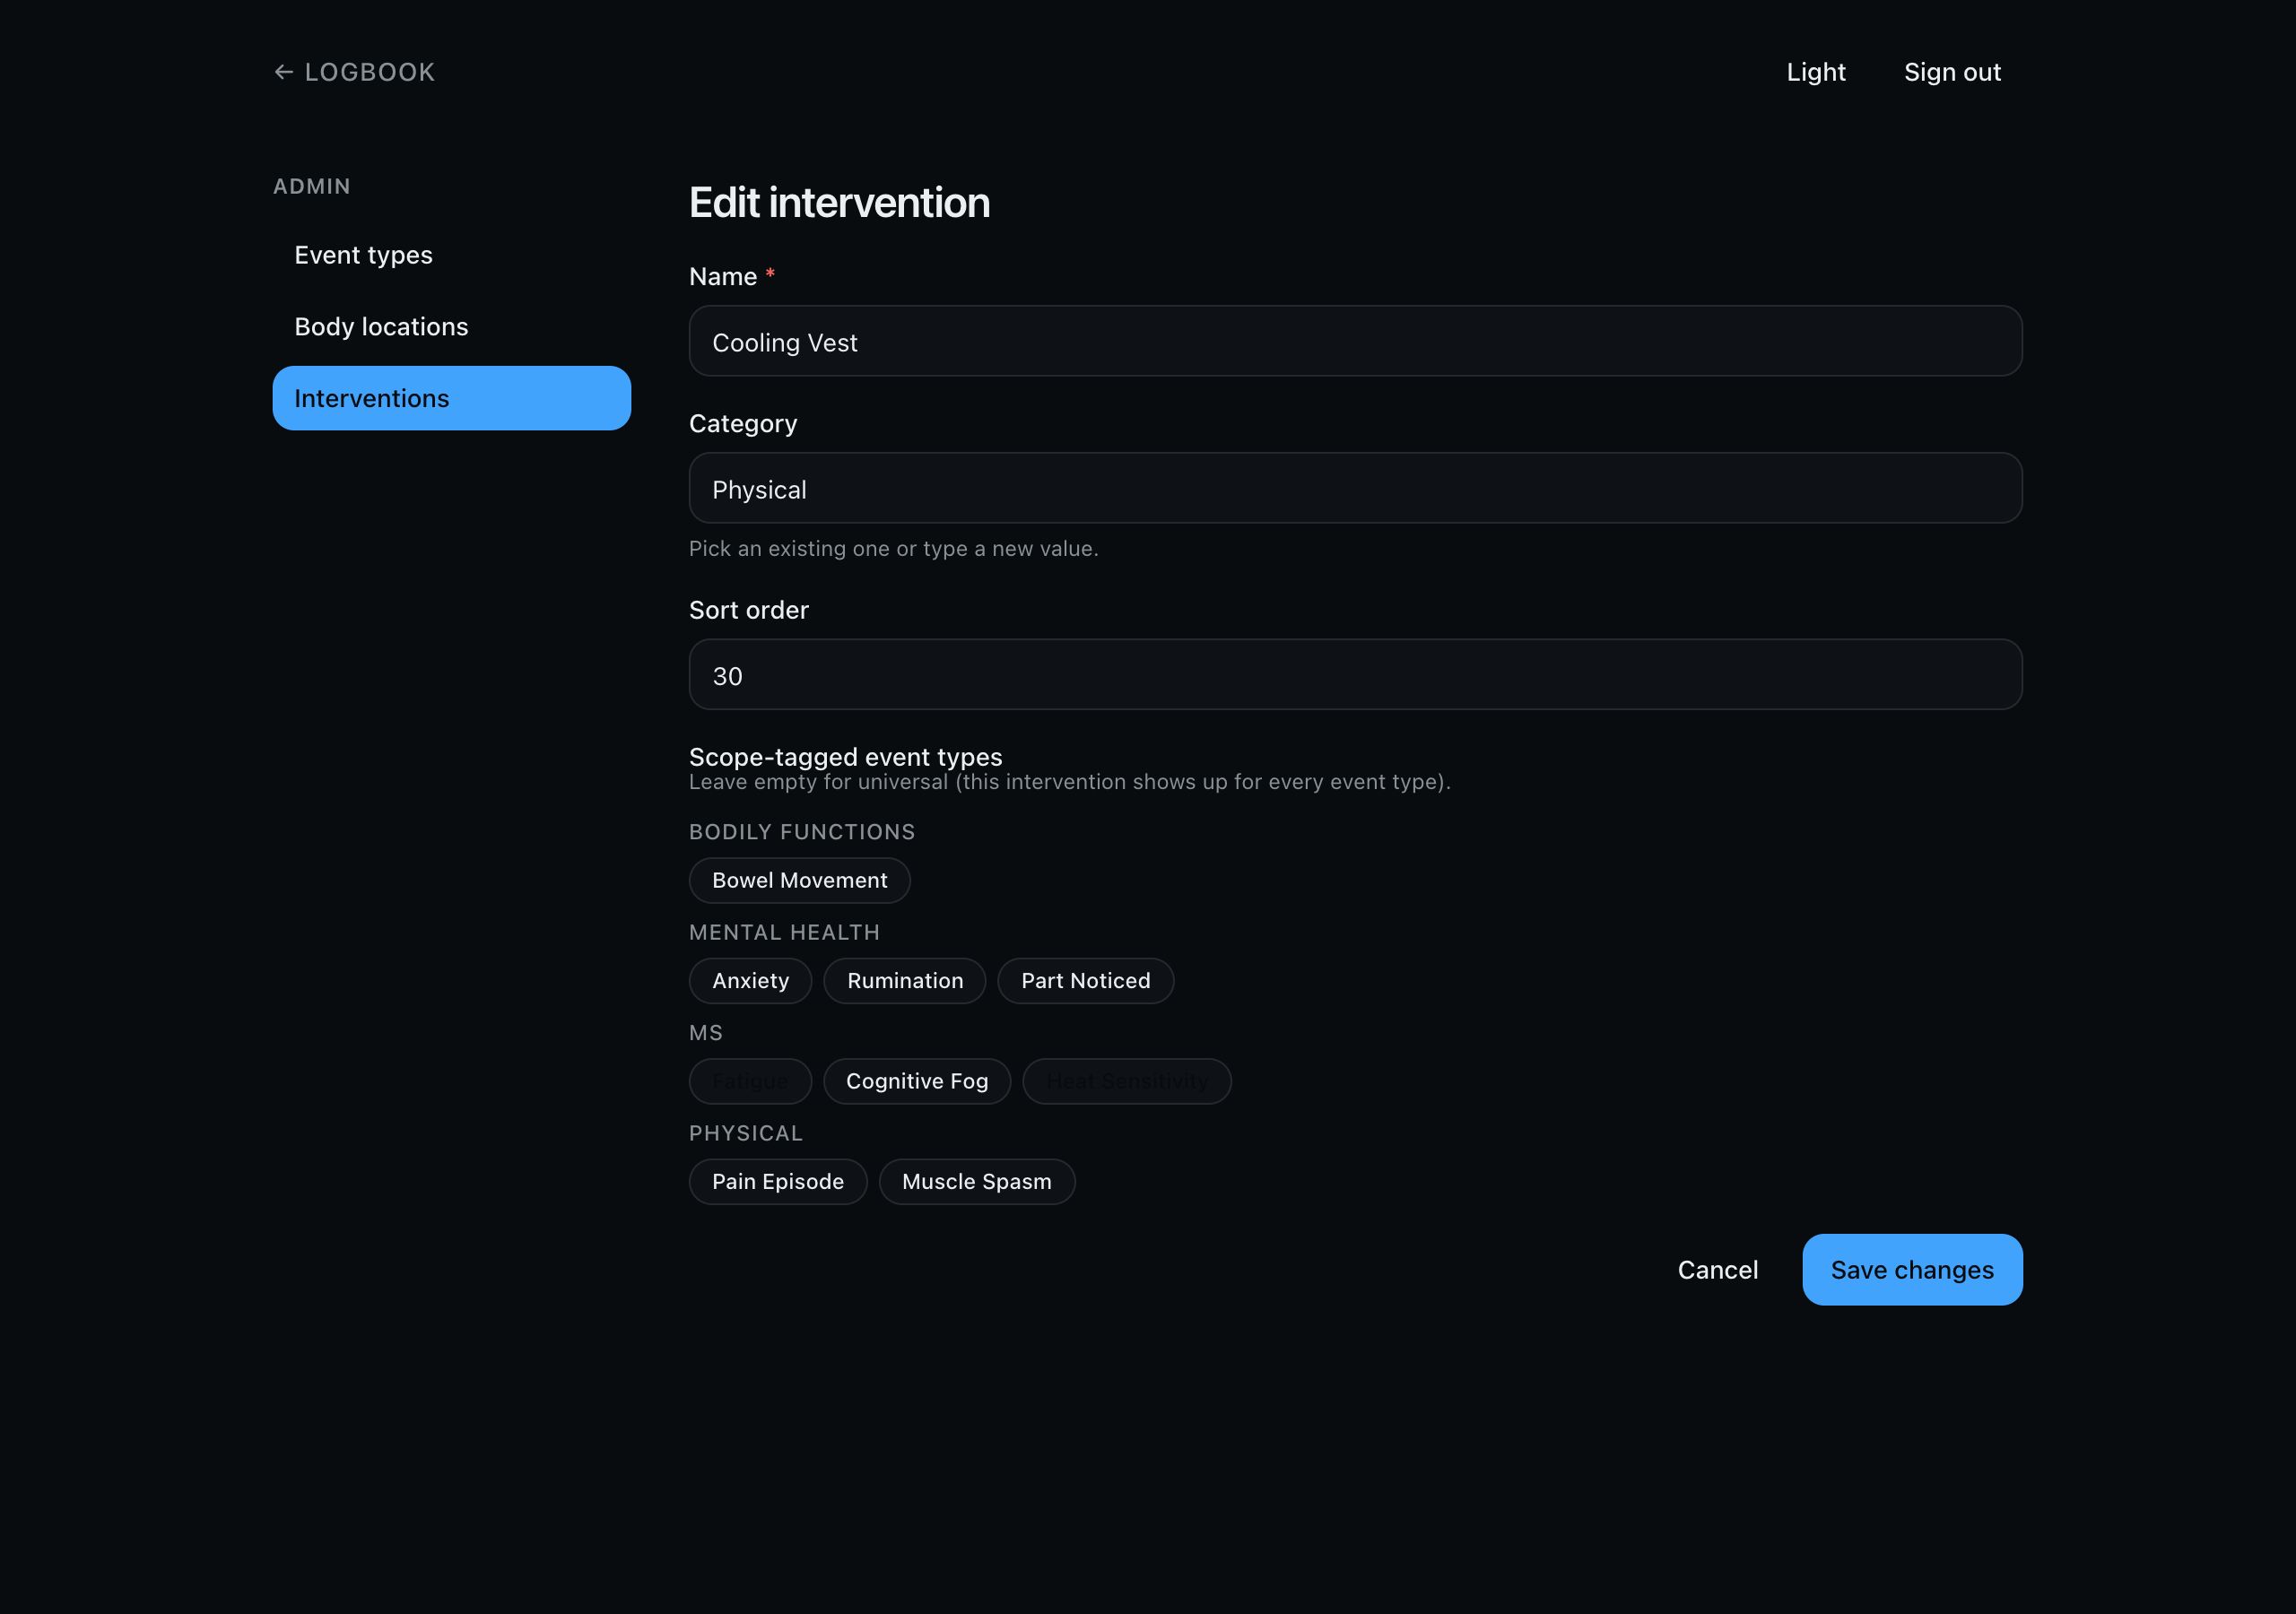
Every screen works in both themes. Logbook follows your device setting the first time, and the toggle in the header remembers your choice. All colors come from one set of design tokens, and both themes are checked for contrast. See How it's built.
Signing in
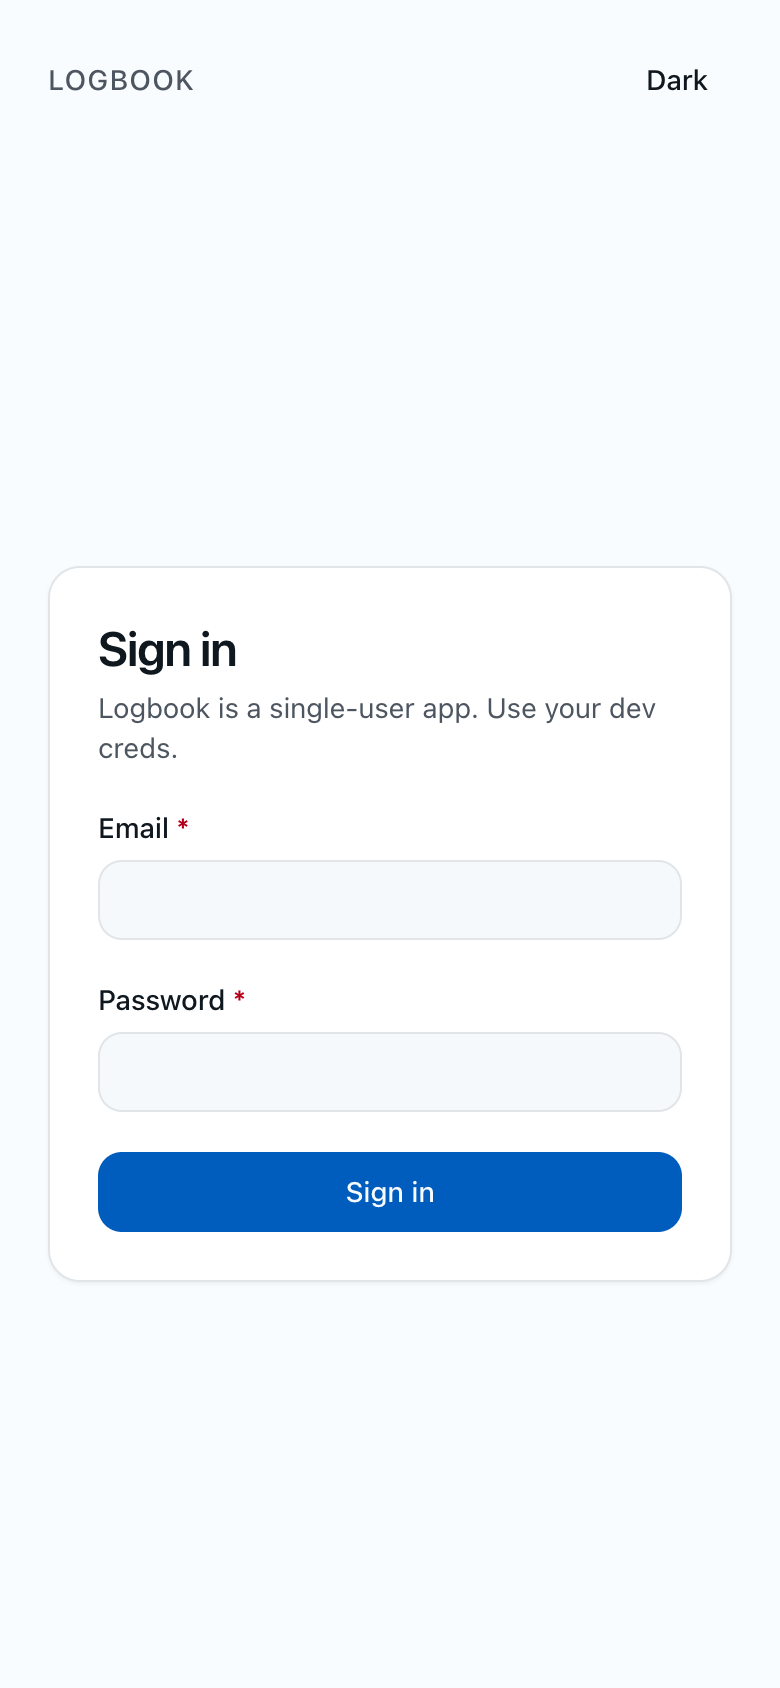
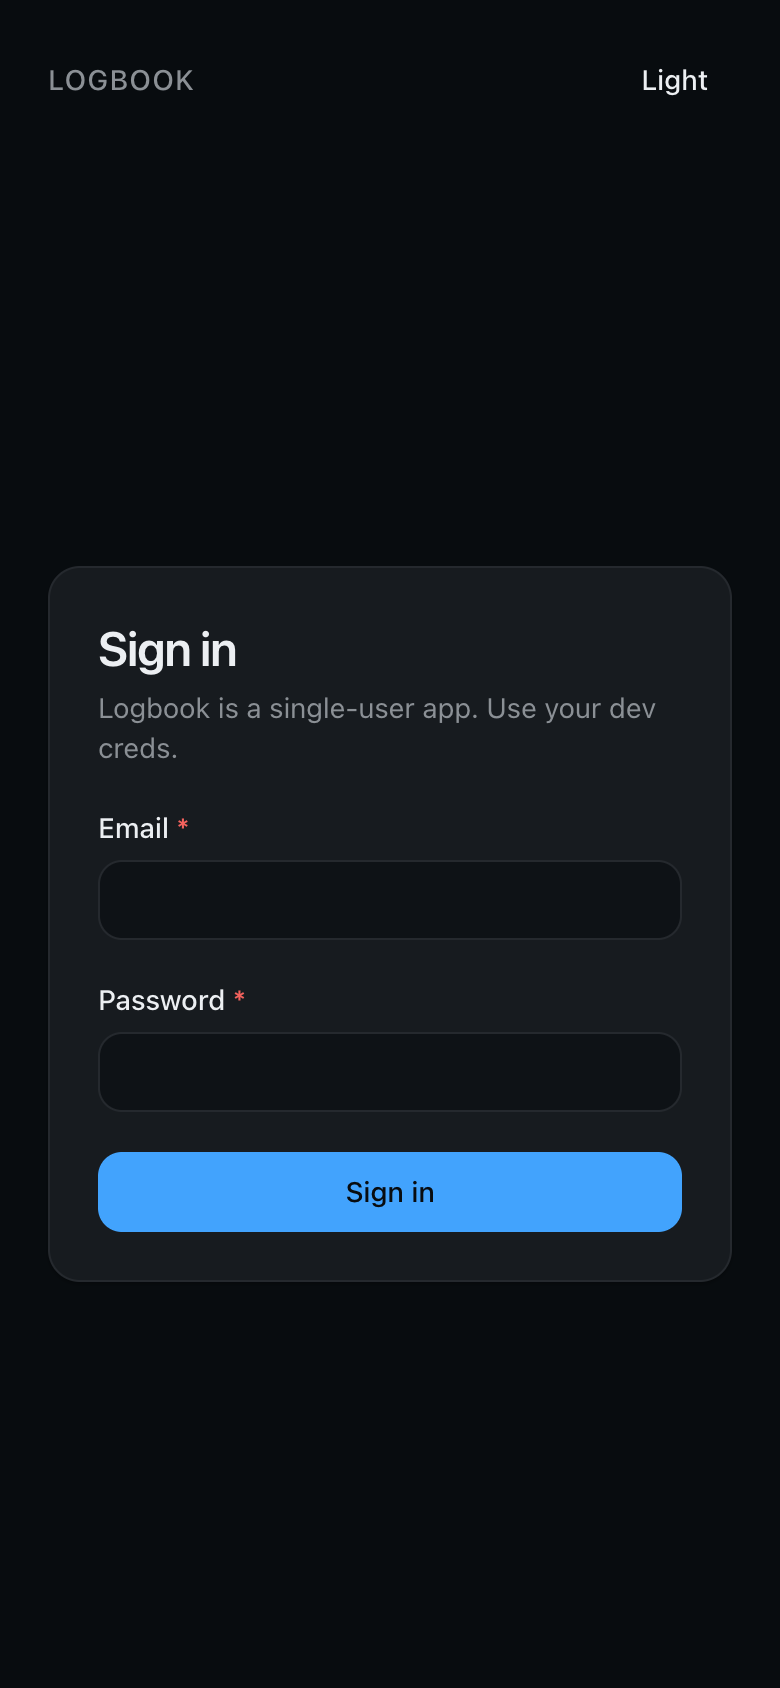
Logbook is a single-person app: email and password, and no sign-up page. Every page except sign-in requires a valid session, checked on the server.